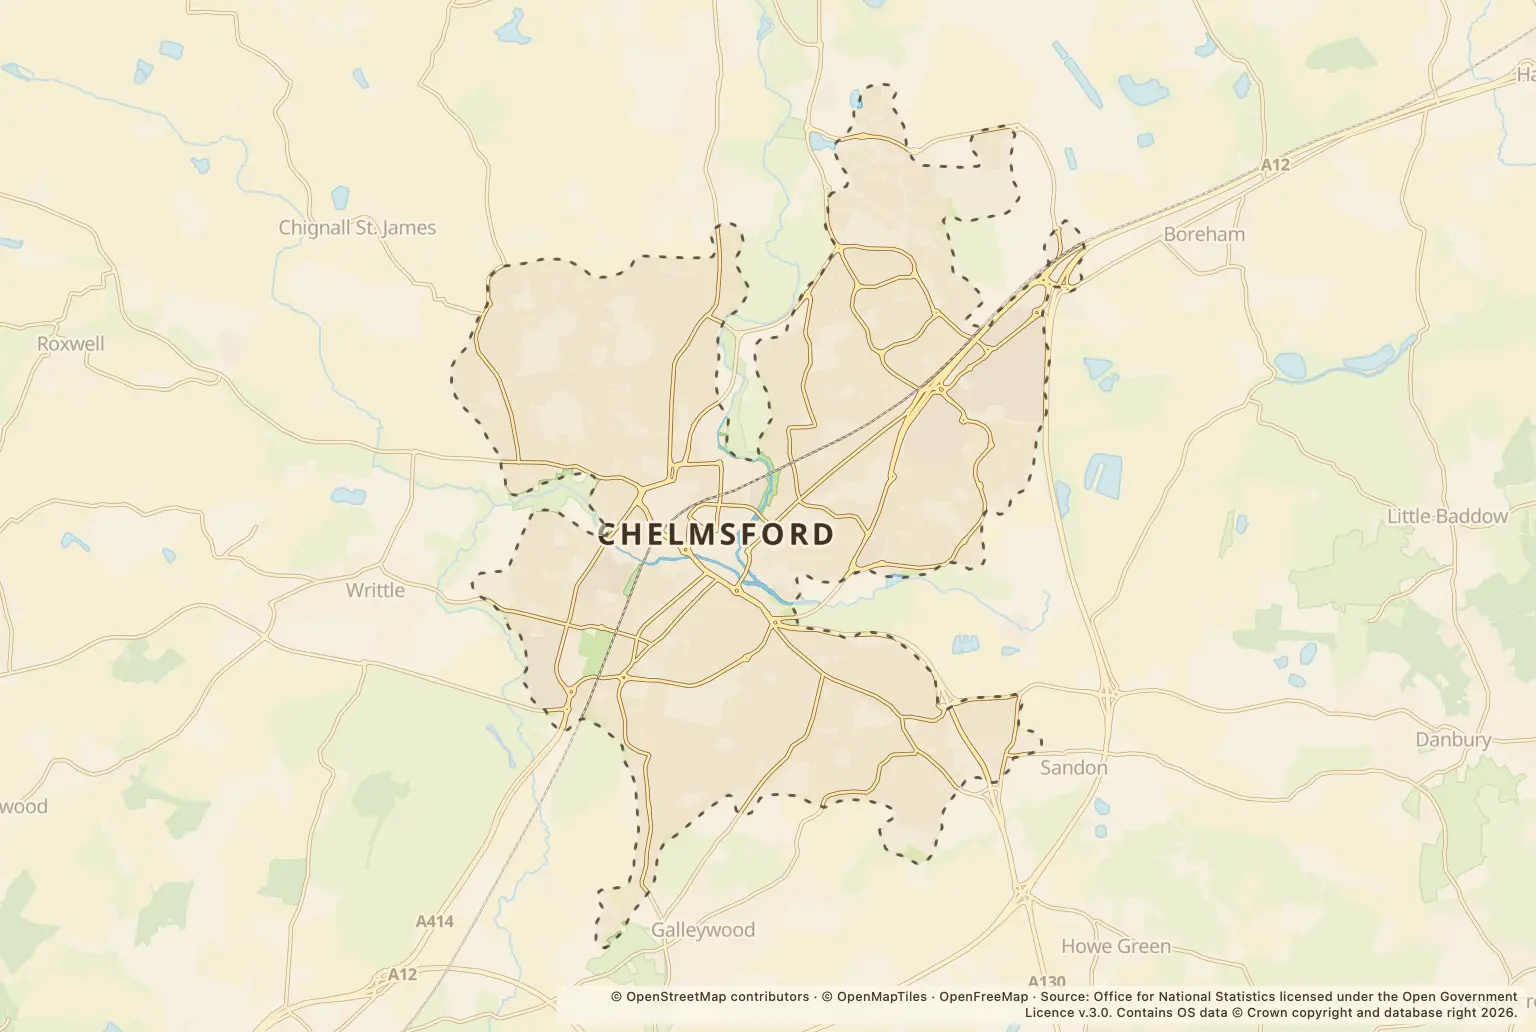
Chelmsford recorded 11579 crimes in 2025. Violence and sexual offences accounted for 5027.
Which types of crime were recorded in Chelmsford in 2025?
| Crime type | Recorded crimes |
|---|---|
| Violence and sexual offences | 5027 |
| Shoplifting | 1344 |
| Public order | 846 |
| Anti-social behaviour | 809 |
| Other theft | 748 |
| Criminal damage and arson | 717 |
| Drugs | 629 |
| Vehicle crime | 405 |
| Burglary | 322 |
| Other crime | 290 |
| Bicycle theft | 123 |
| Theft from the person | 121 |
| Possession of weapons | 99 |
| Robbery | 99 |
Violence and sexual offences were the biggest category. Shoplifting was the next largest, with 1344 recorded crimes.
Source: police.uk, street-level crime figures for 2025.
Which month had the most recorded crime in Chelmsford?
May 2025 had the highest monthly total, with 1090 recorded crimes.
How can I check crime near me in Chelmsford?
Use the police.uk crime map and neighbourhood policing team to look up local crime information and find neighbourhood policing contacts.
About the figures
The figures are published by police.uk and cover 2025. They count crimes recorded by police; they are not a crime rate, and the figures do not show how many crimes went unreported. A publication date is not stated.