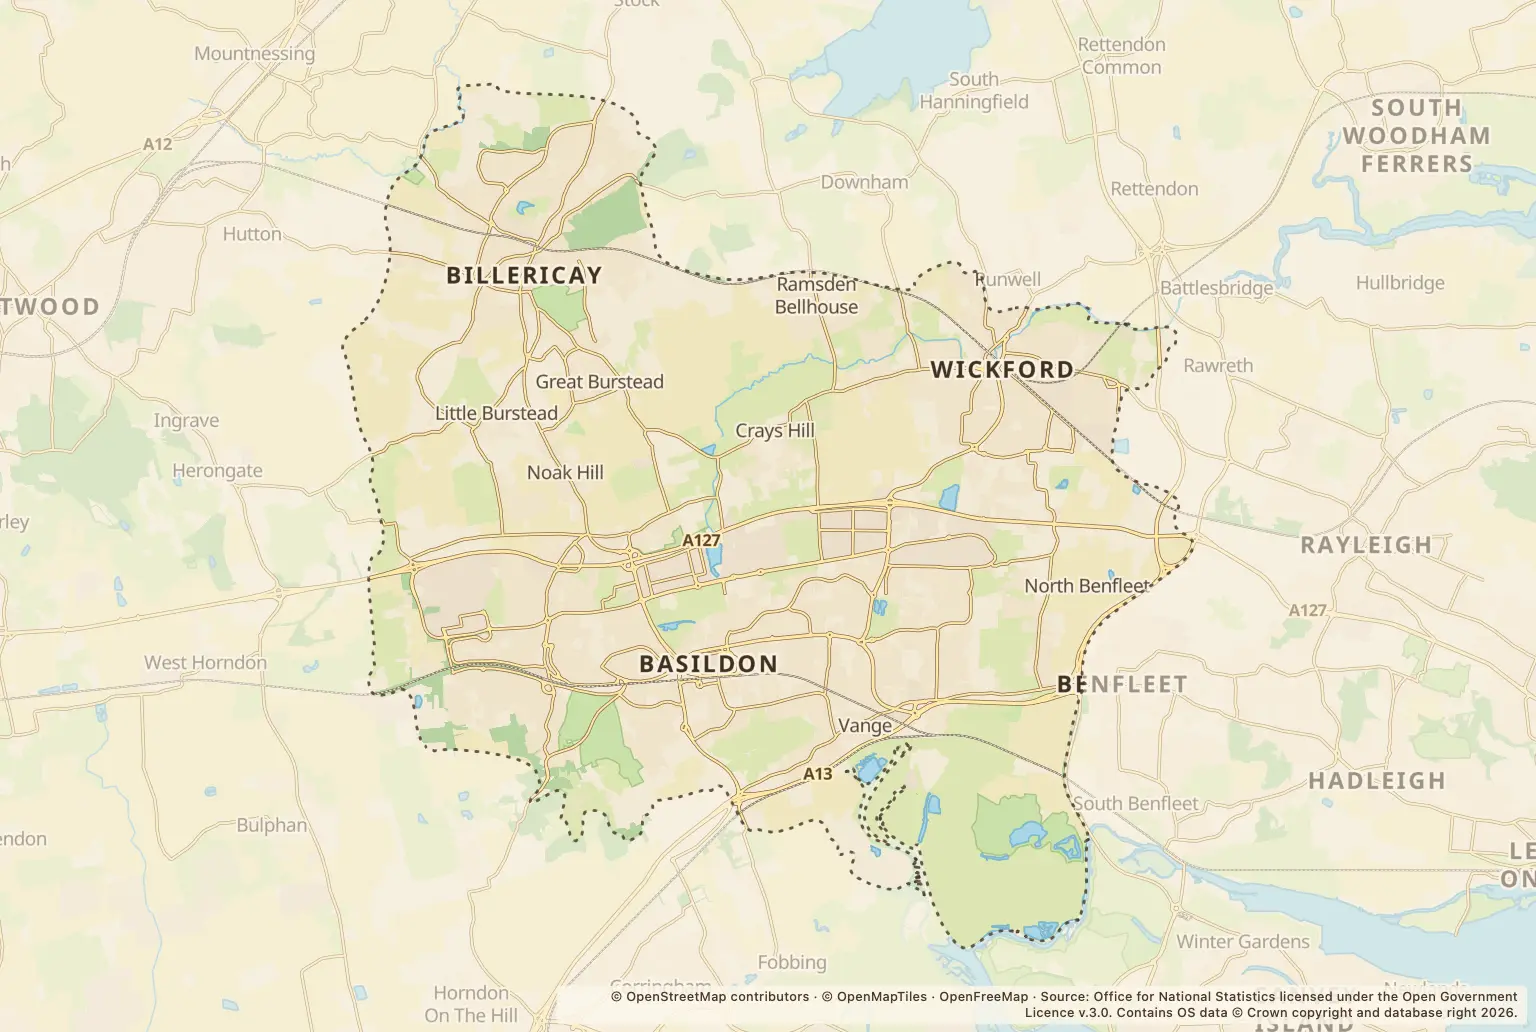
Basildon
3 towns
- Average home
- £367,920
- Plans approved
- 90%
- Food rated five
- 81%

The councils that run Essex, and how their areas compare.
3 towns
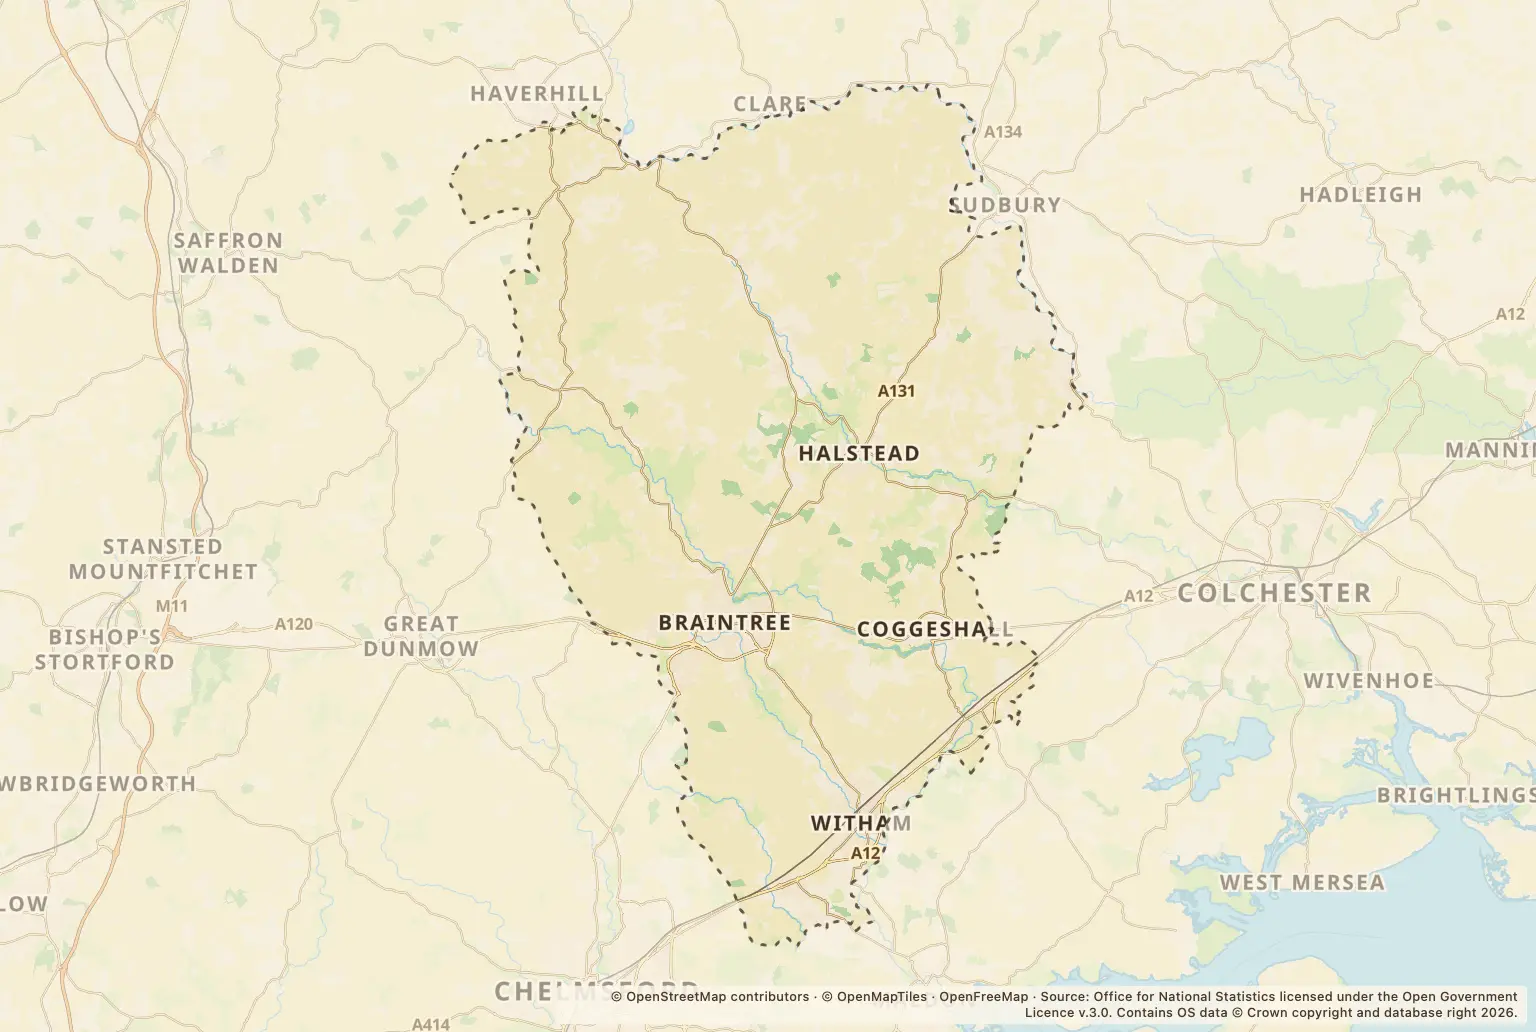
4 towns
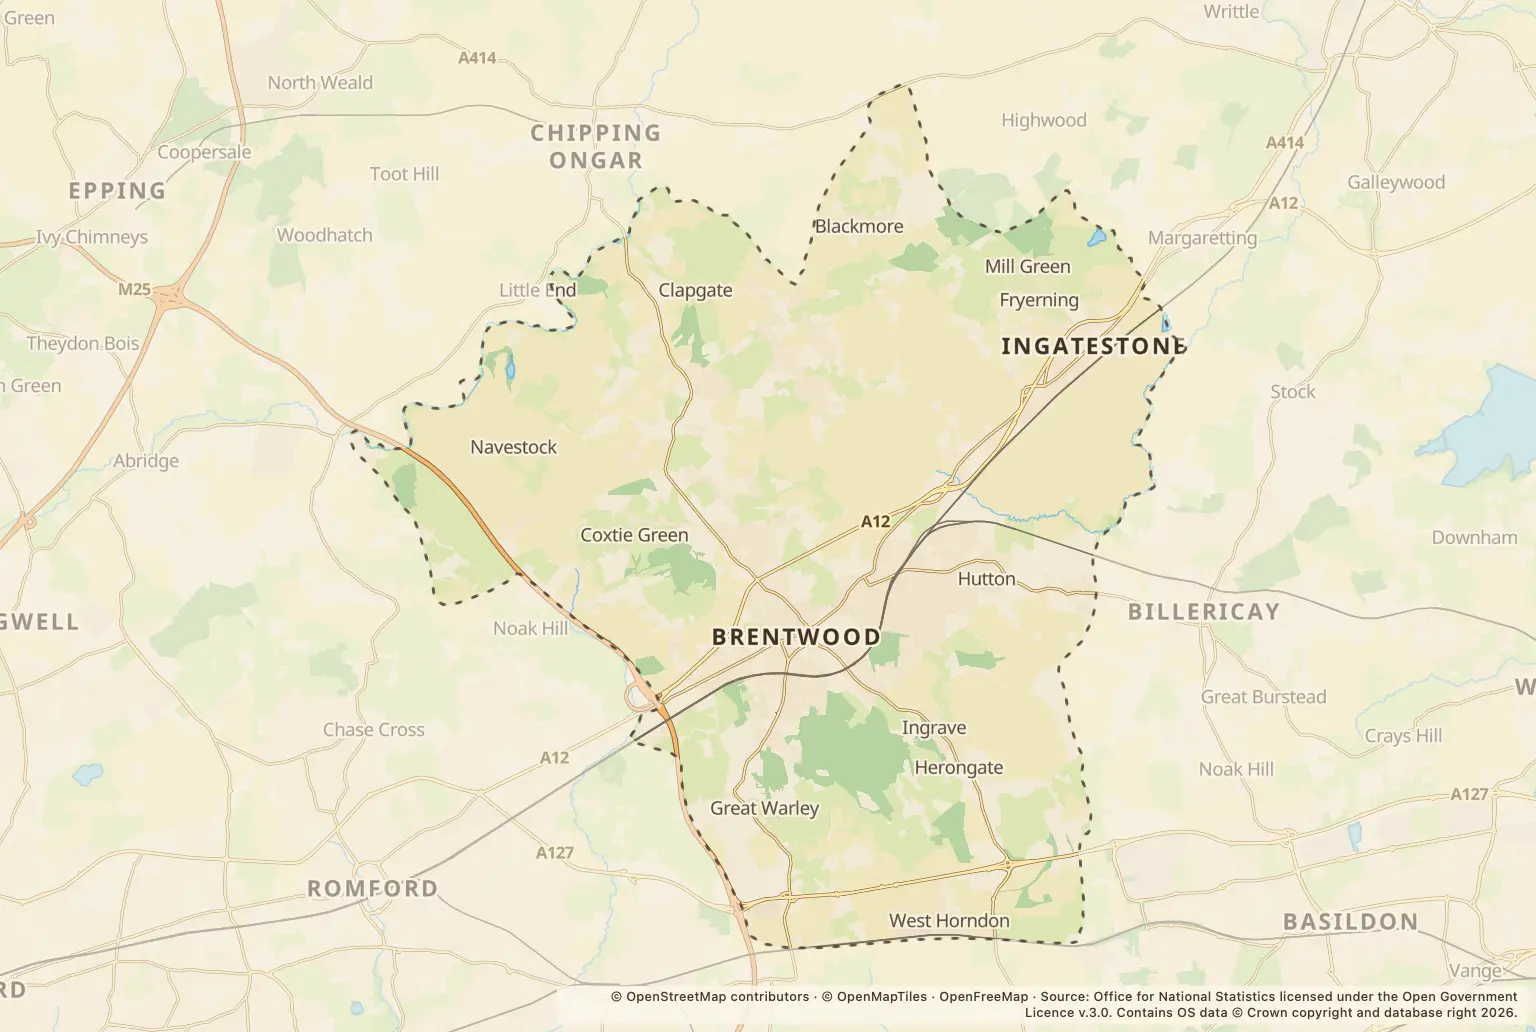
1 town
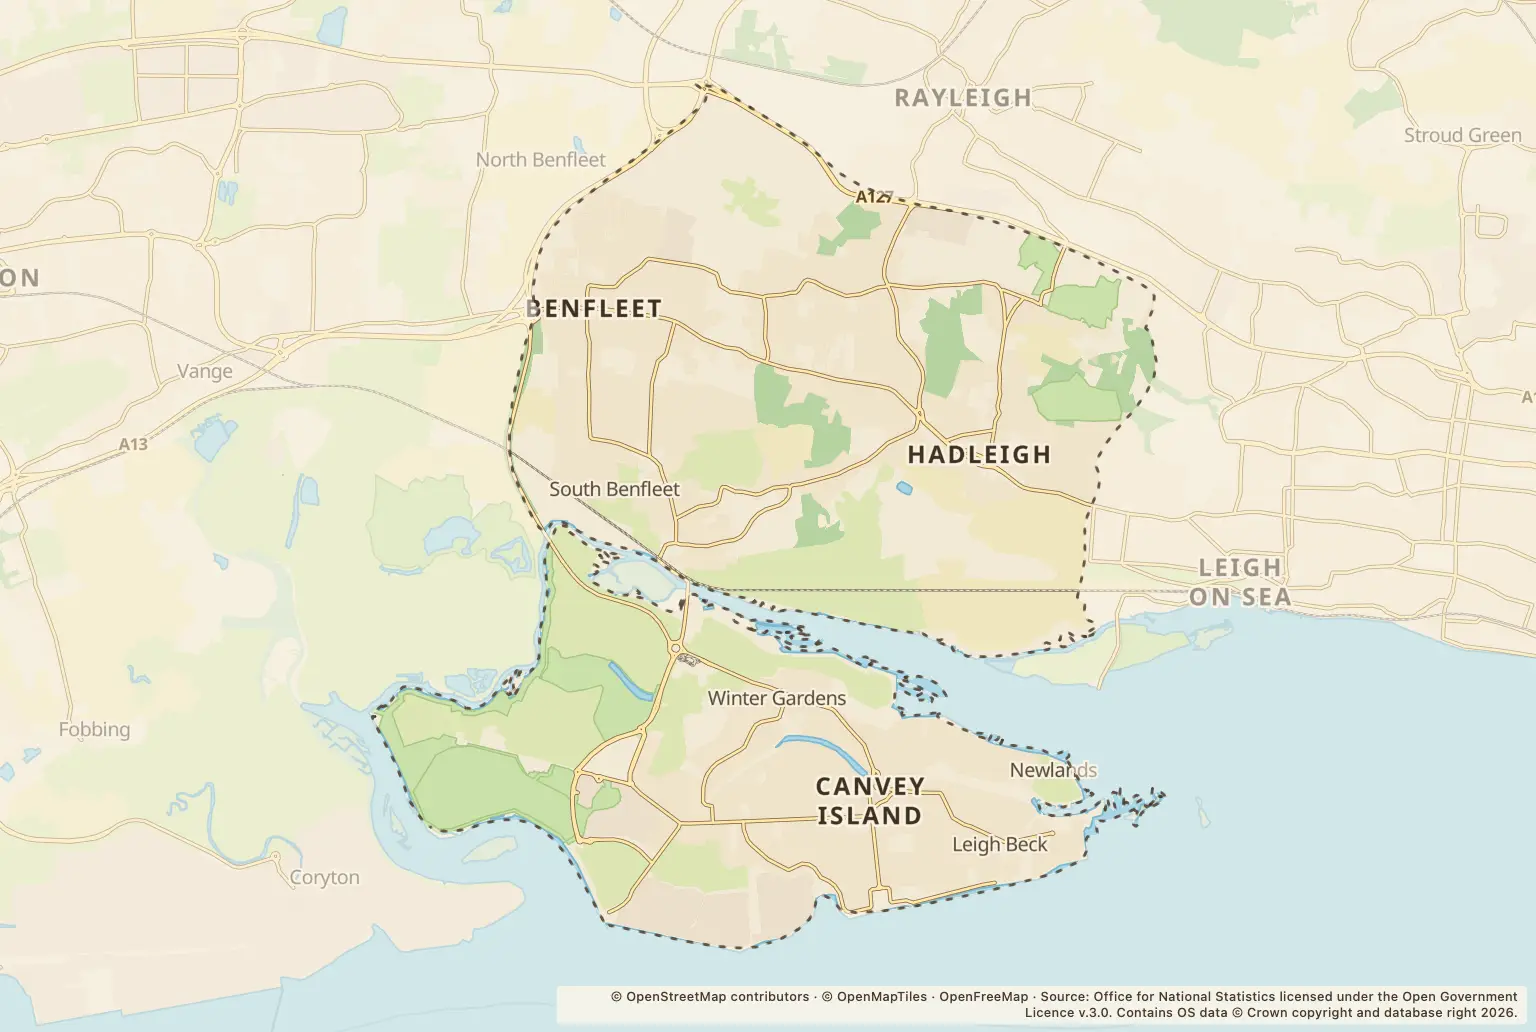
1 town
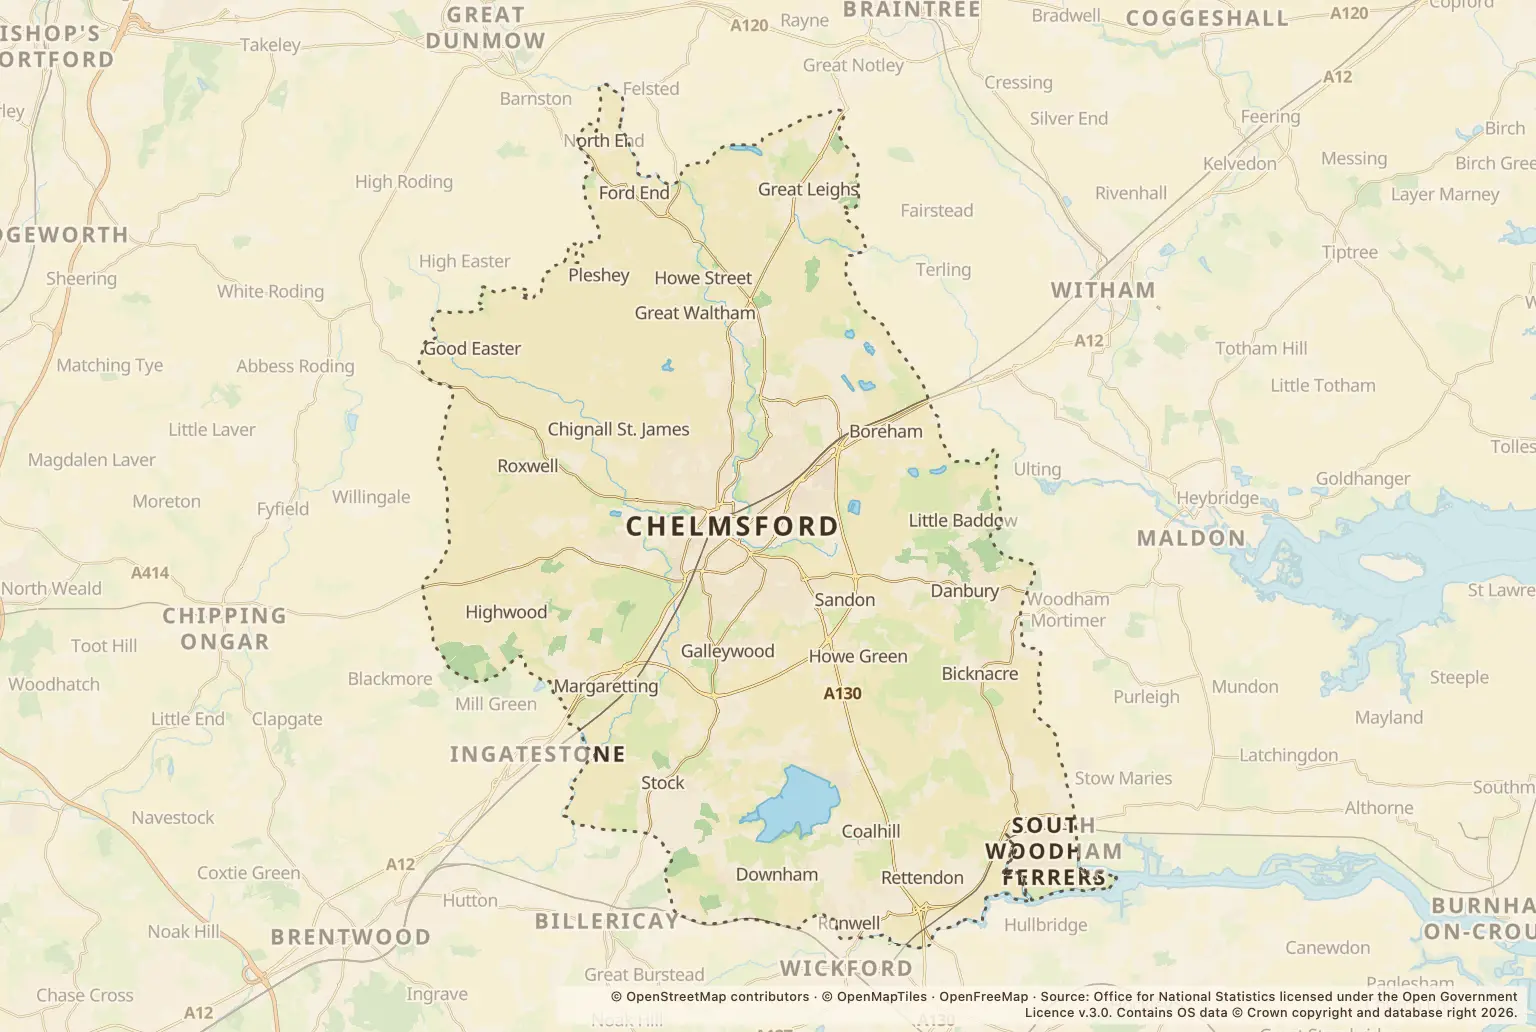
2 towns
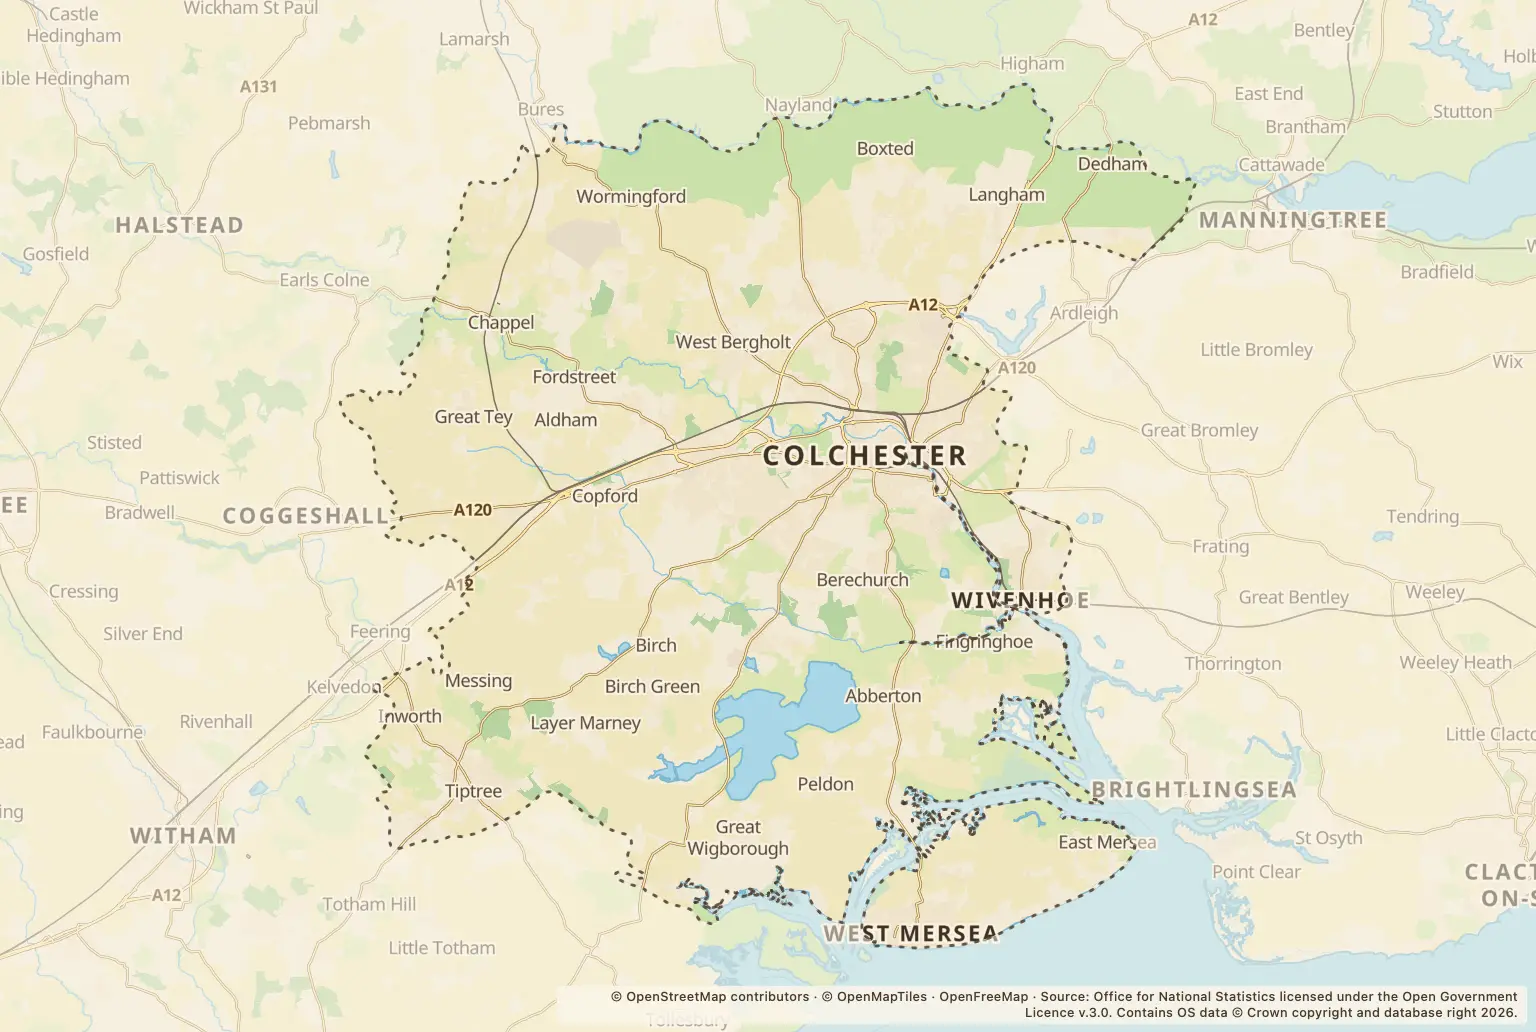
3 towns
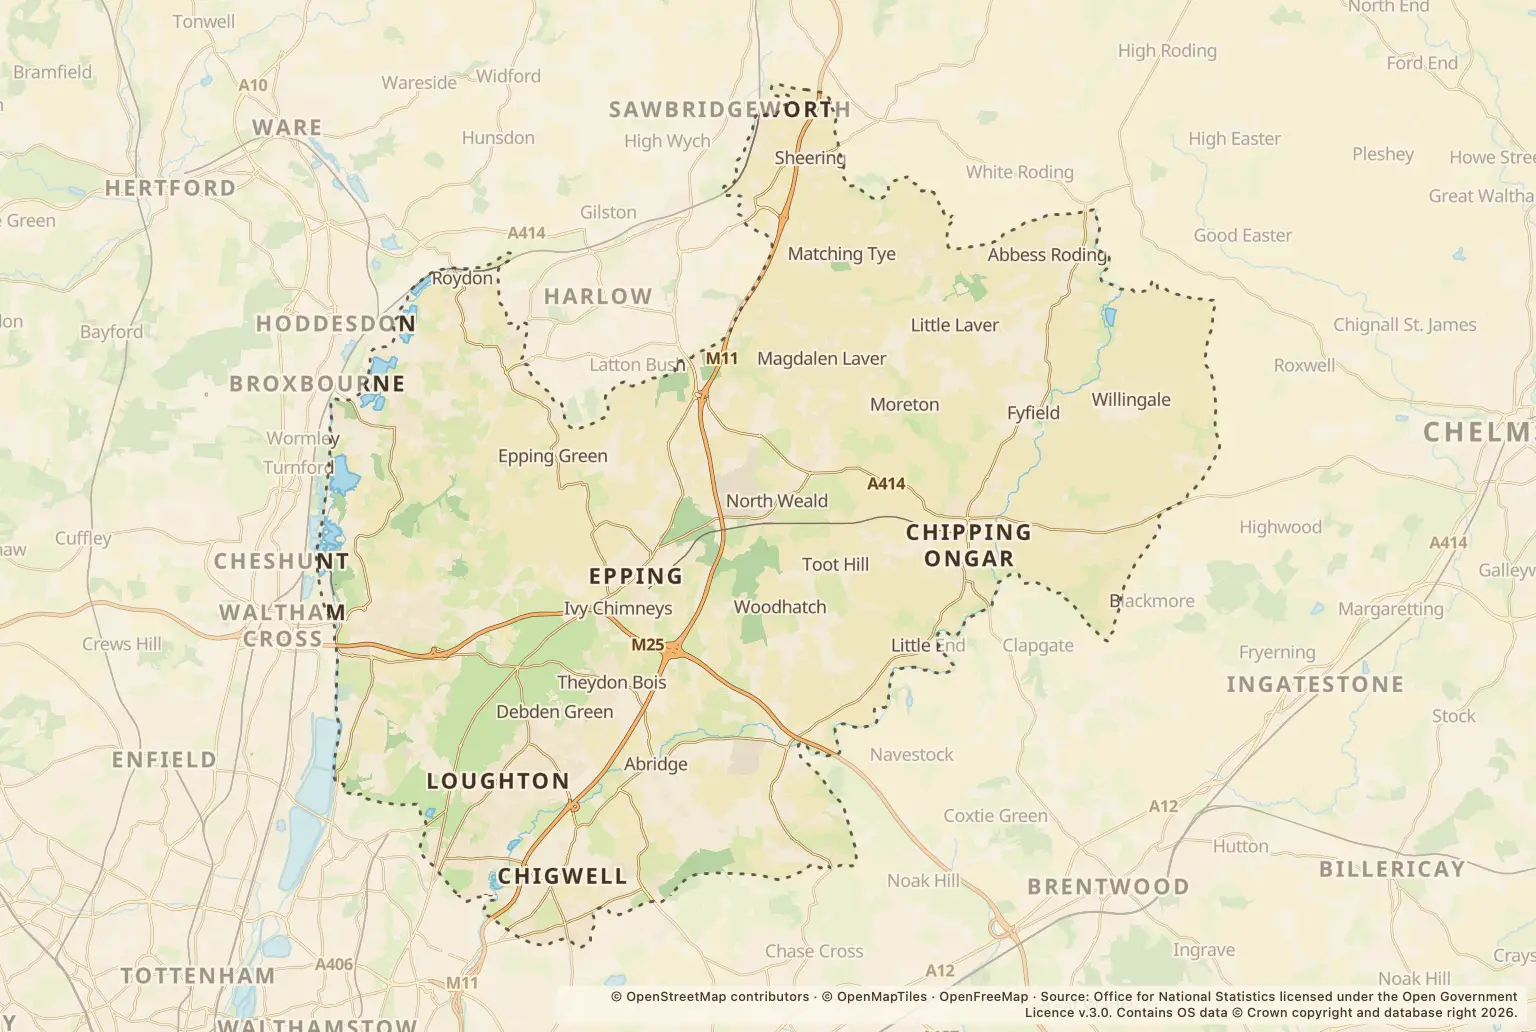
5 towns
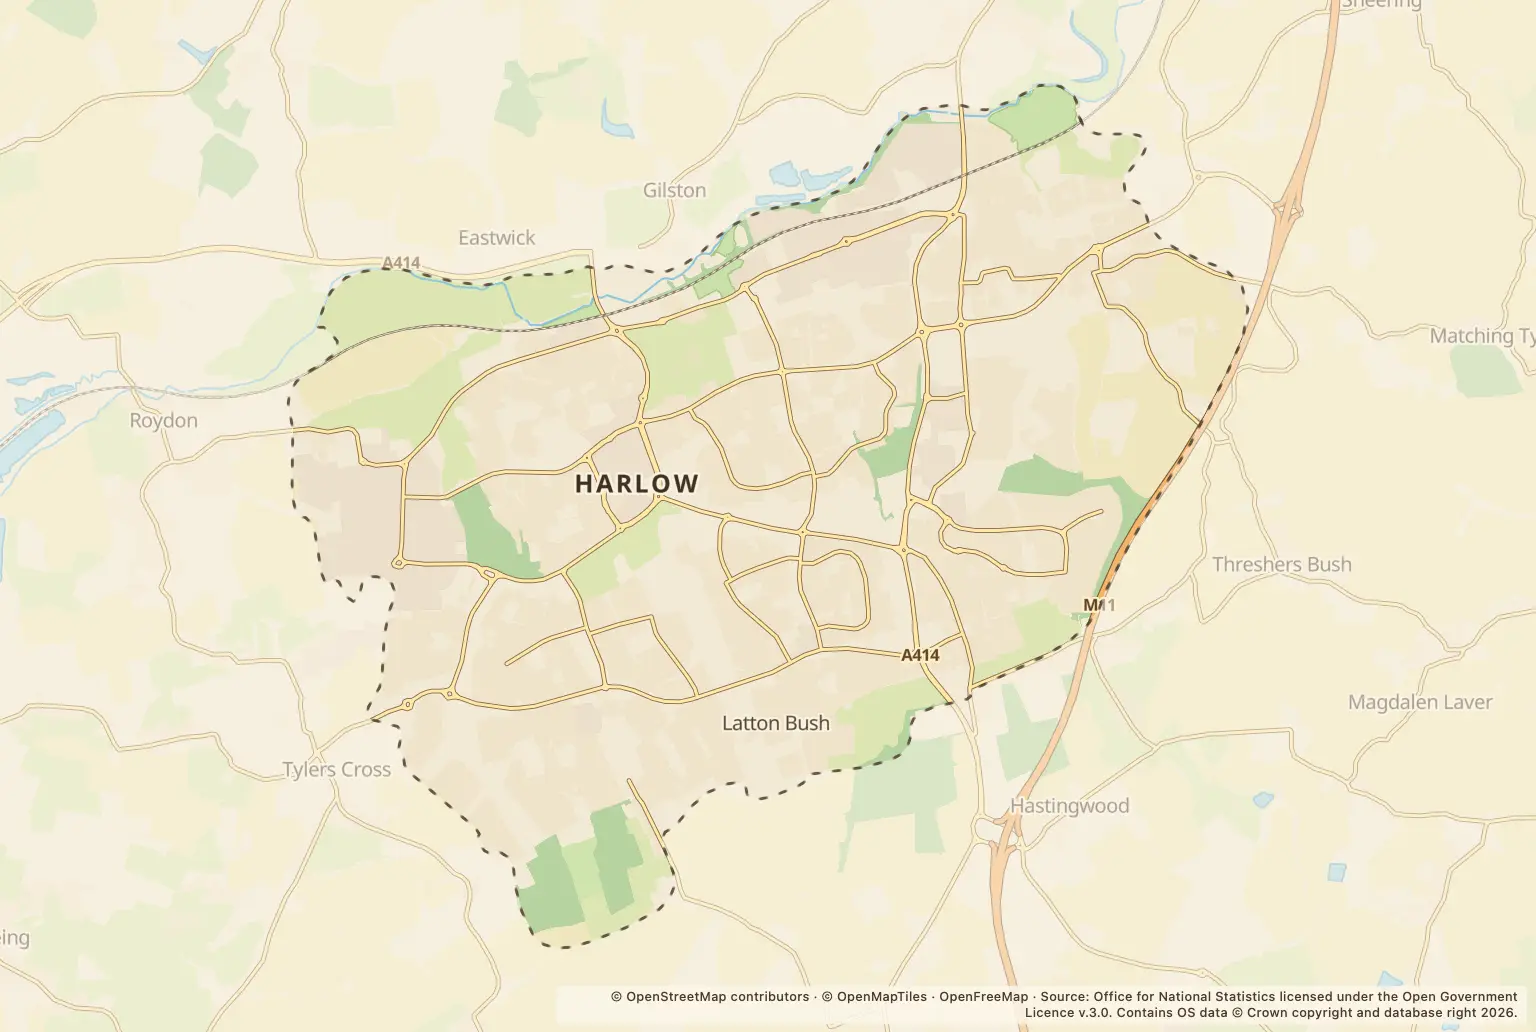
1 town
3 towns
2 towns
1 town
6 towns
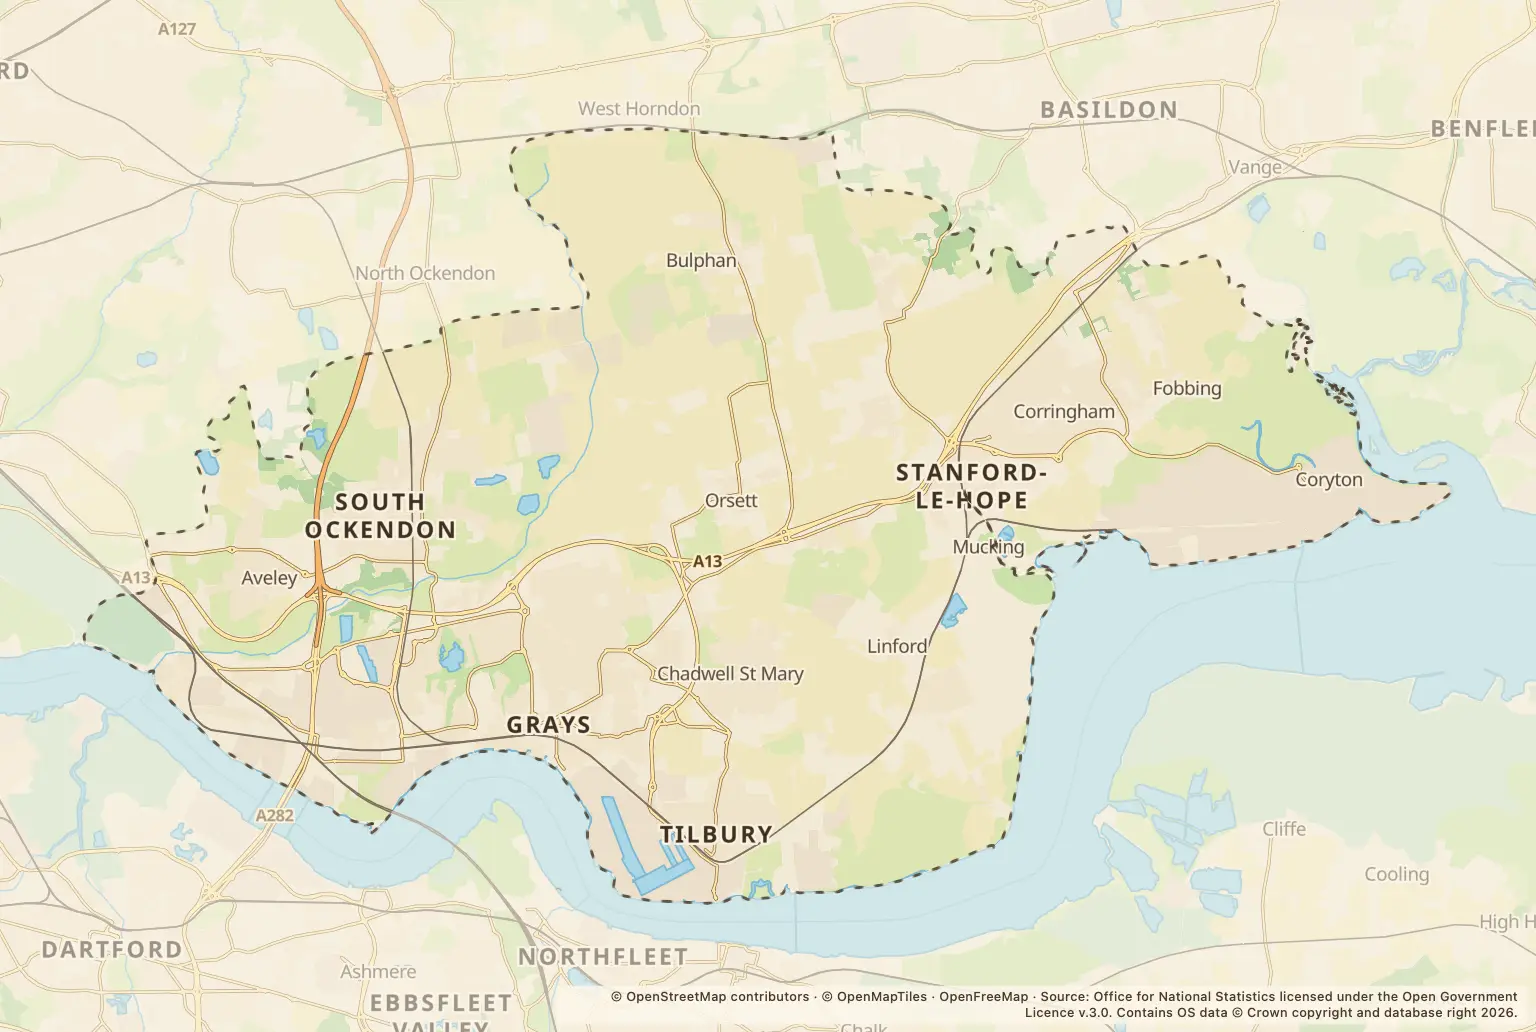
3 towns
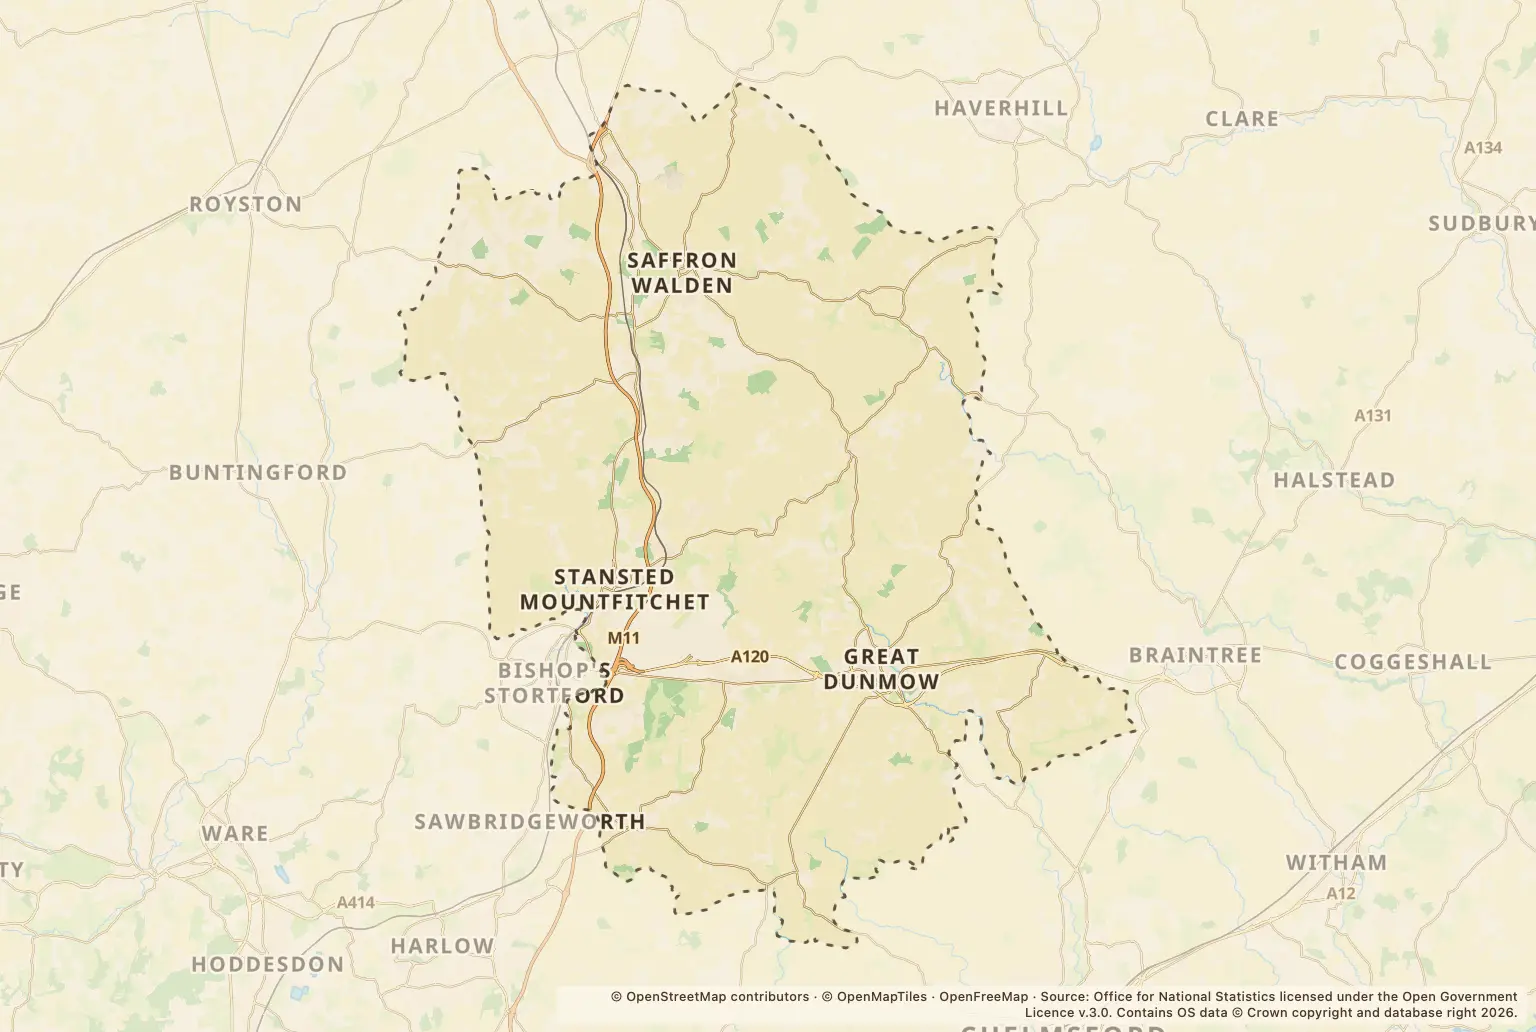
4 towns
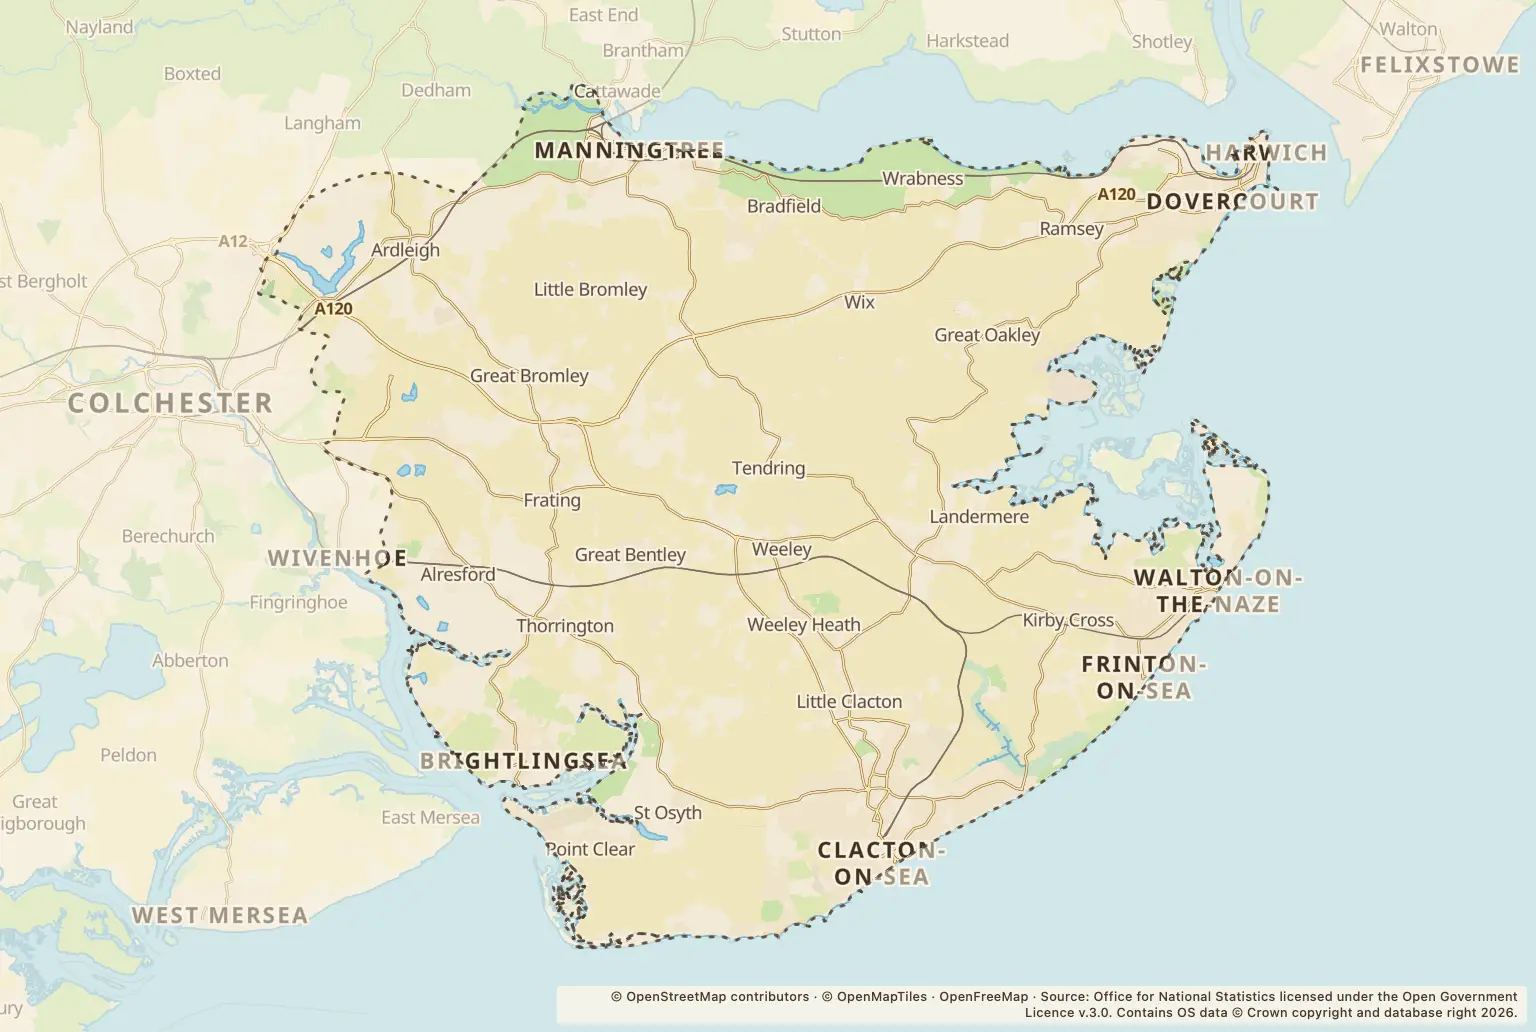
 Tendring
1st cheapest of 14
Tendring is the cheapest place to buy a home in Essex out of 14 council areas, with an average price of £258,932 (HM Land Registry, September 2026).
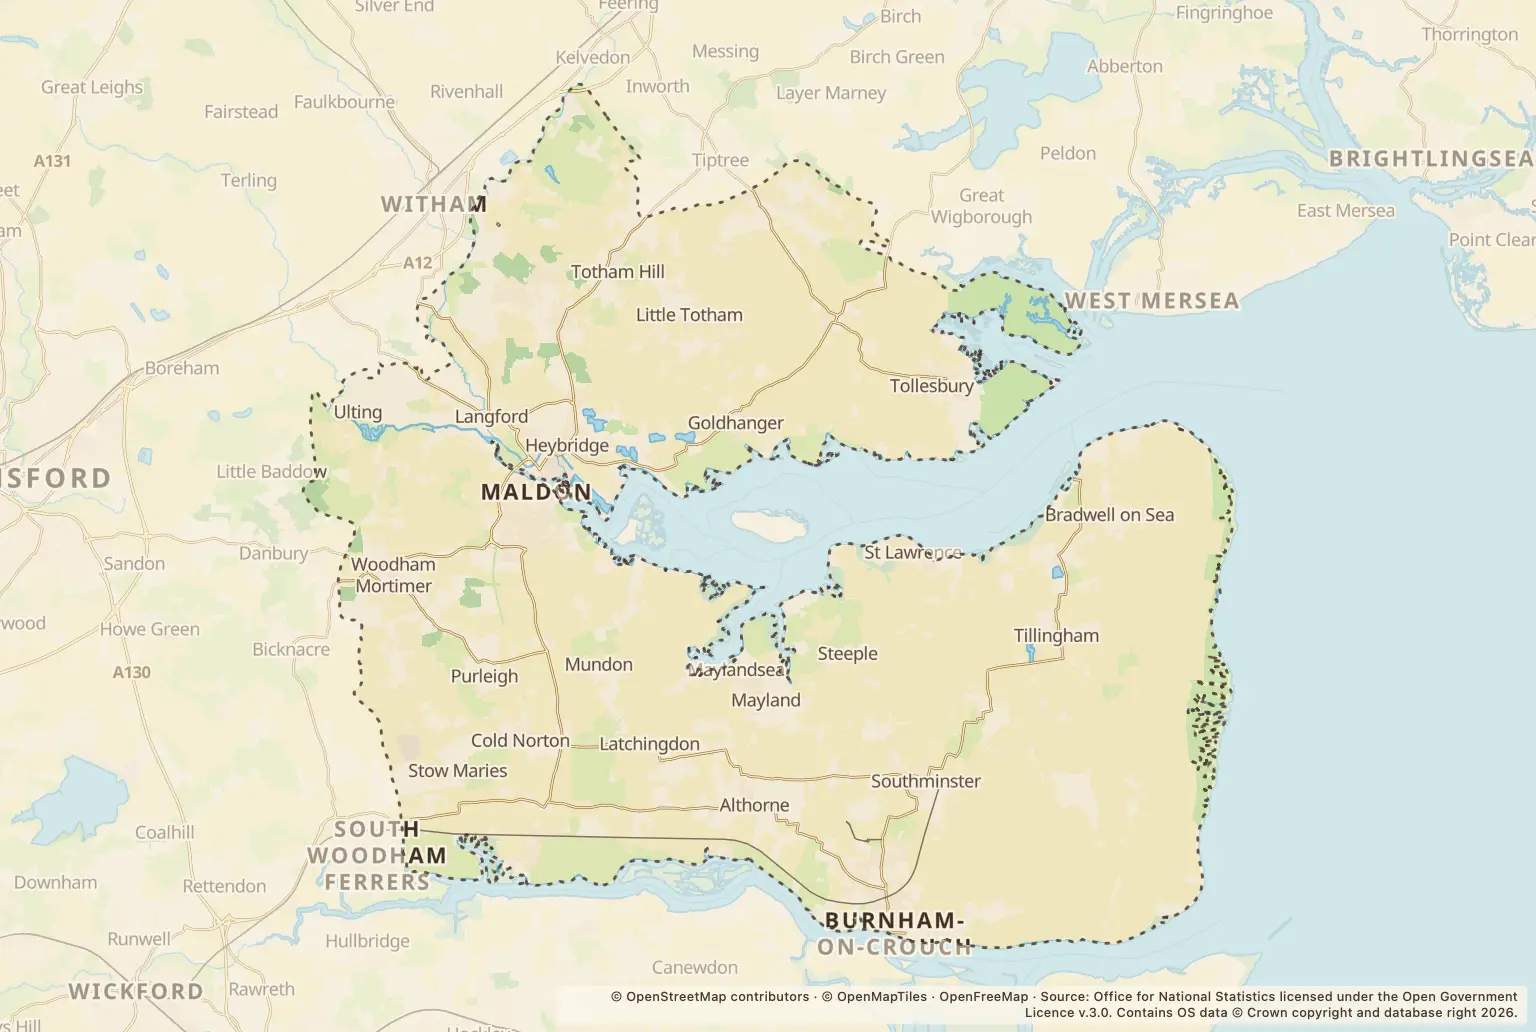
Tendring council area Maldon
1st fastest-growing of 14
Maldon has the fastest-growing house prices in Essex out of 14 council areas, with average prices changing by +5.0% over a year (HM Land Registry, September 2026).
Maldon council area Brentwood
1st highest of 7
Brentwood has the highest planning approval rate in Essex out of 7 councils, approving 97% of 34 decided applications.
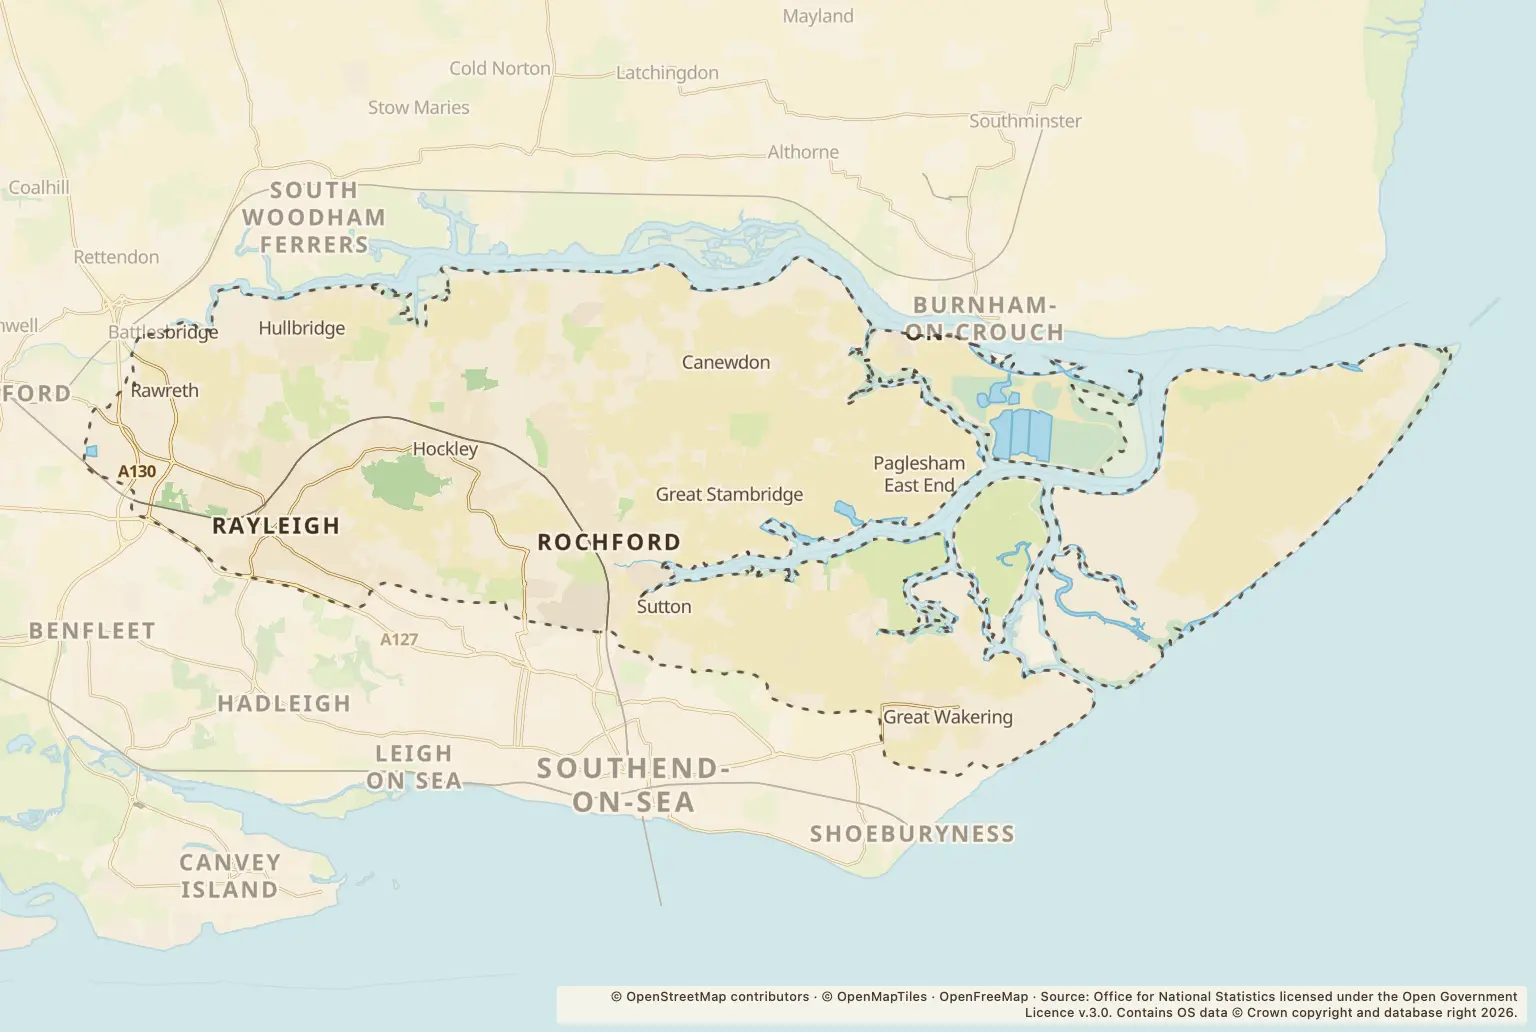
Brentwood council area Castle Point
1st fastest of 7
Castle Point is the fastest Essex council to decide planning applications out of 7, taking a typical 36 days from validation to decision.
Castle Point council areaCheapest: Tendring
From £258,932 to £536,719
Fastest-growing: Maldon
From -2.2% to +5.0%
Highest: Brentwood
From 80% to 97%
Fastest: Castle Point
From 36 days to 56 days

Highest: Castle Point
From 67% to 93%

Cheapest: Tendring
From 158.4p to 168.6p
| Council | Average house price | Price change | Planning approved | Typical days to decide | Rated five for hygiene | Average petrol |
|---|---|---|---|---|---|---|
| Basildon | £367,920 | +0.8% | 90% | 43 | 81% | 160.9p |
| Braintree | £324,264 | +0.5% | – | – | 85% | 161.0p |
| Brentwood | £520,447 | +0.2% | 97% | 52 | 83% | 166.7p |
| Castle Point | £368,191 | -0.7% | 95% | 36 | 93% | 160.0p |
| Chelmsford | £378,412 | -0.8% | 92% | 36 | 92% | 162.0p |
| Colchester | £297,638 | +0.9% | – | – | 91% | 161.1p |
| Epping Forest | £536,719 | +2.1% | – | – | 85% | 164.6p |
| Harlow | £317,113 | +3.9% | 89% | 51 | 83% | 166.1p |
| Maldon | £406,165 | +5.0% | 82% | 56 | 89% | 159.1p |
| Rochford | £408,883 | +1.3% | – | – | 83% | 160.5p |
| Southend-on-Sea | £327,570 | +1.8% | 80% | 56 | 71% | 161.0p |
| Tendring | £258,932 | -2.2% | – | – | 67% | 158.4p |
| Thurrock | £322,338 | -0.7% | – | – | 73% | 159.5p |
| Uttlesford | £465,802 | -0.5% | – | – | 90% | 168.6p |
House prices come from the HM Land Registry UK House Price Index. Planning figures cover the applications we collect from each council’s register; a dash means there are too few to say. Food hygiene ratings come from the Food Standards Agency and fuel prices from the government’s Fuel Finder service.