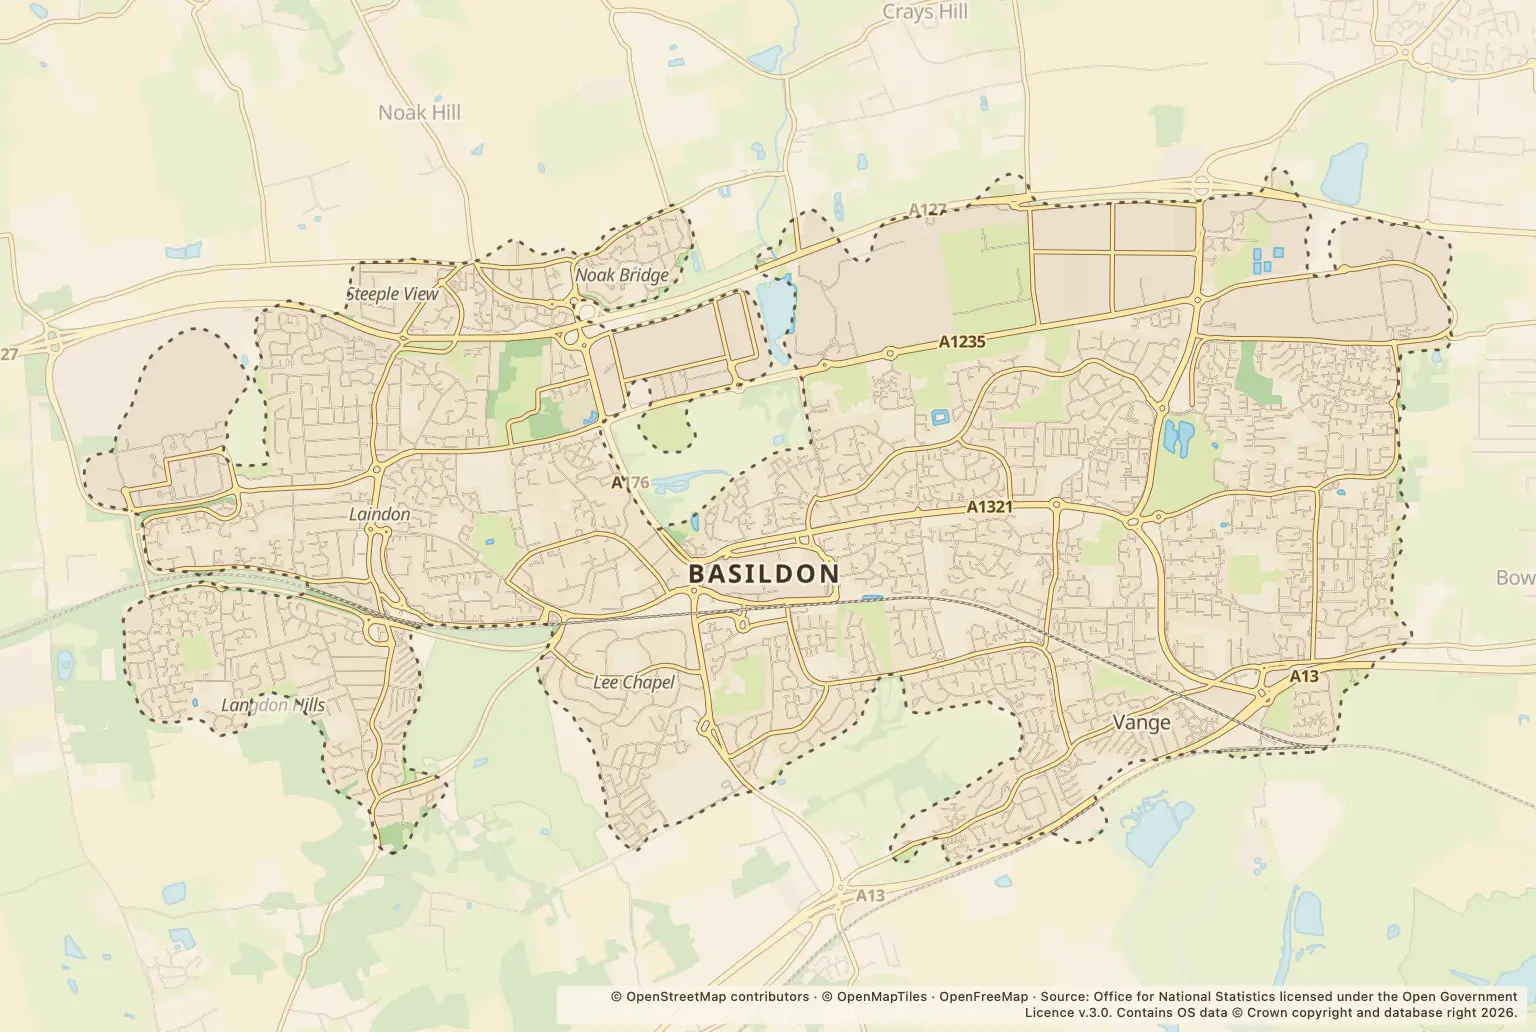
There were 1317 recorded crimes in Basildon in September 2026, up 8% from 1216 in September 2025. Anti-social behaviour rose 90%, the largest percentage increase among the listed categories.
Which crimes were most common in Basildon?
Violence and sexual offences accounted for the largest number, with 516 recorded, compared with 469 a year earlier. Anti-social behaviour was next, with 199, followed by shoplifting with 122.
Which crime categories rose or fell?
| Crime category | September 2026 | September 2025 | Change |
|---|---|---|---|
| Anti-social behaviour | 199 | 105 | up 90% |
| Bicycle theft | 7 | 8 | down 12% |
| Burglary | 28 | 32 | down 12% |
| Criminal damage and arson | 93 | 117 | down 21% |
| Drugs | 57 | 66 | down 14% |
| Other theft | 76 | 66 | up 15% |
| Possession of weapons | 17 | 10 | up 70% |
| Public order | 72 | 94 | down 23% |
| Robbery | 15 | 13 | up 15% |
| Shoplifting | 122 | 104 | up 17% |
| Theft from the person | 7 | 12 | down 42% |
| Vehicle crime | 82 | 94 | down 13% |
| Violence and sexual offences | 516 | 469 | up 10% |
| Other crime | 26 | 26 | unchanged |
Source: police.uk Street-level crime figures for September 2026, compared with September 2025.
The biggest percentage increase was in anti-social behaviour, which rose from 105 to 199. Possession of weapons rose from 10 to 17. By contrast, criminal damage and arson fell from 117 to 93, while burglaries fell from 32 to 28.
How can I check crime near me?
Use the police.uk crime map and neighbourhood policing team service to look up local crime information and find neighbourhood policing details.
About the figures
The figures cover recorded crimes in Basildon during September 2026 and compare them with September 2025. The publication date is not stated. These are counts, not a population-adjusted crime rate, and cover one month only.