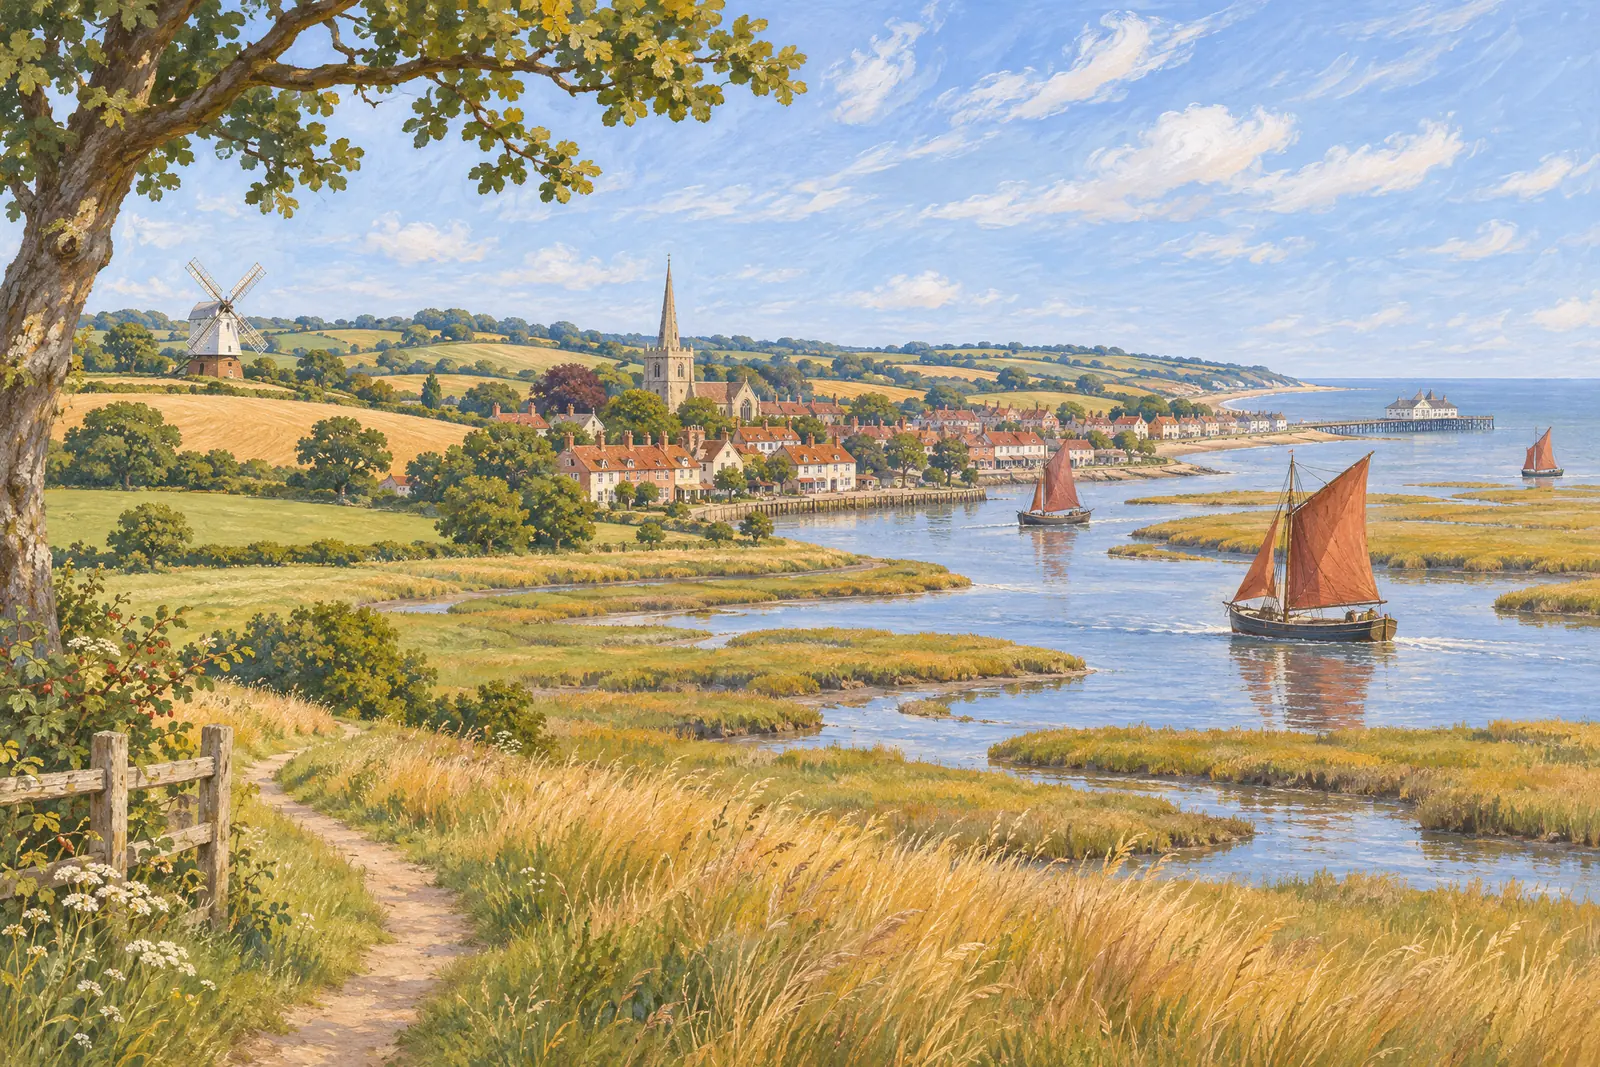
Essex BriefingThe month in reviewOctober 2026Burnham-on-Crouch45Crimes recorded, September£406,165Average price, September40Homes sold, August
The month in review, October 2026
Inside this issue
The latest official figures for Burnham-on-Crouch at the end of October 2026: 45 crimes recorded, an average house price of £406,165, 40 home sales registered, a claimant rate of 2.5% and 9 new companies.
Each chapter names its source and the month its figures are for. House prices, home sales and the claimant count cover the whole Maldon council area.
3The month in numbers
4In pictures
6Crime, SeptemberRecorded crime rose 2%
8House prices, SeptemberHouse prices rose 5.0%
10Home sales, August40 home sales registered so far
12JobsThe claimant count rose 9%
14New businesses9 new companies registered
16The past 12 months
18About the figures
Essex Briefing · Burnham-on-Crouch October 2026
The month in numbers
Burnham-on-Crouch in October 2026
The headline figure from each chapter of this issue.
Crimes recorded, September
45up 2% on a year earlier
Average price, September
£406,165up 5.0% on a year earlier
Homes sold, August
40registered so far
Claimant rate
2.5%England 4.1%
New companies
98 in September
In pictures
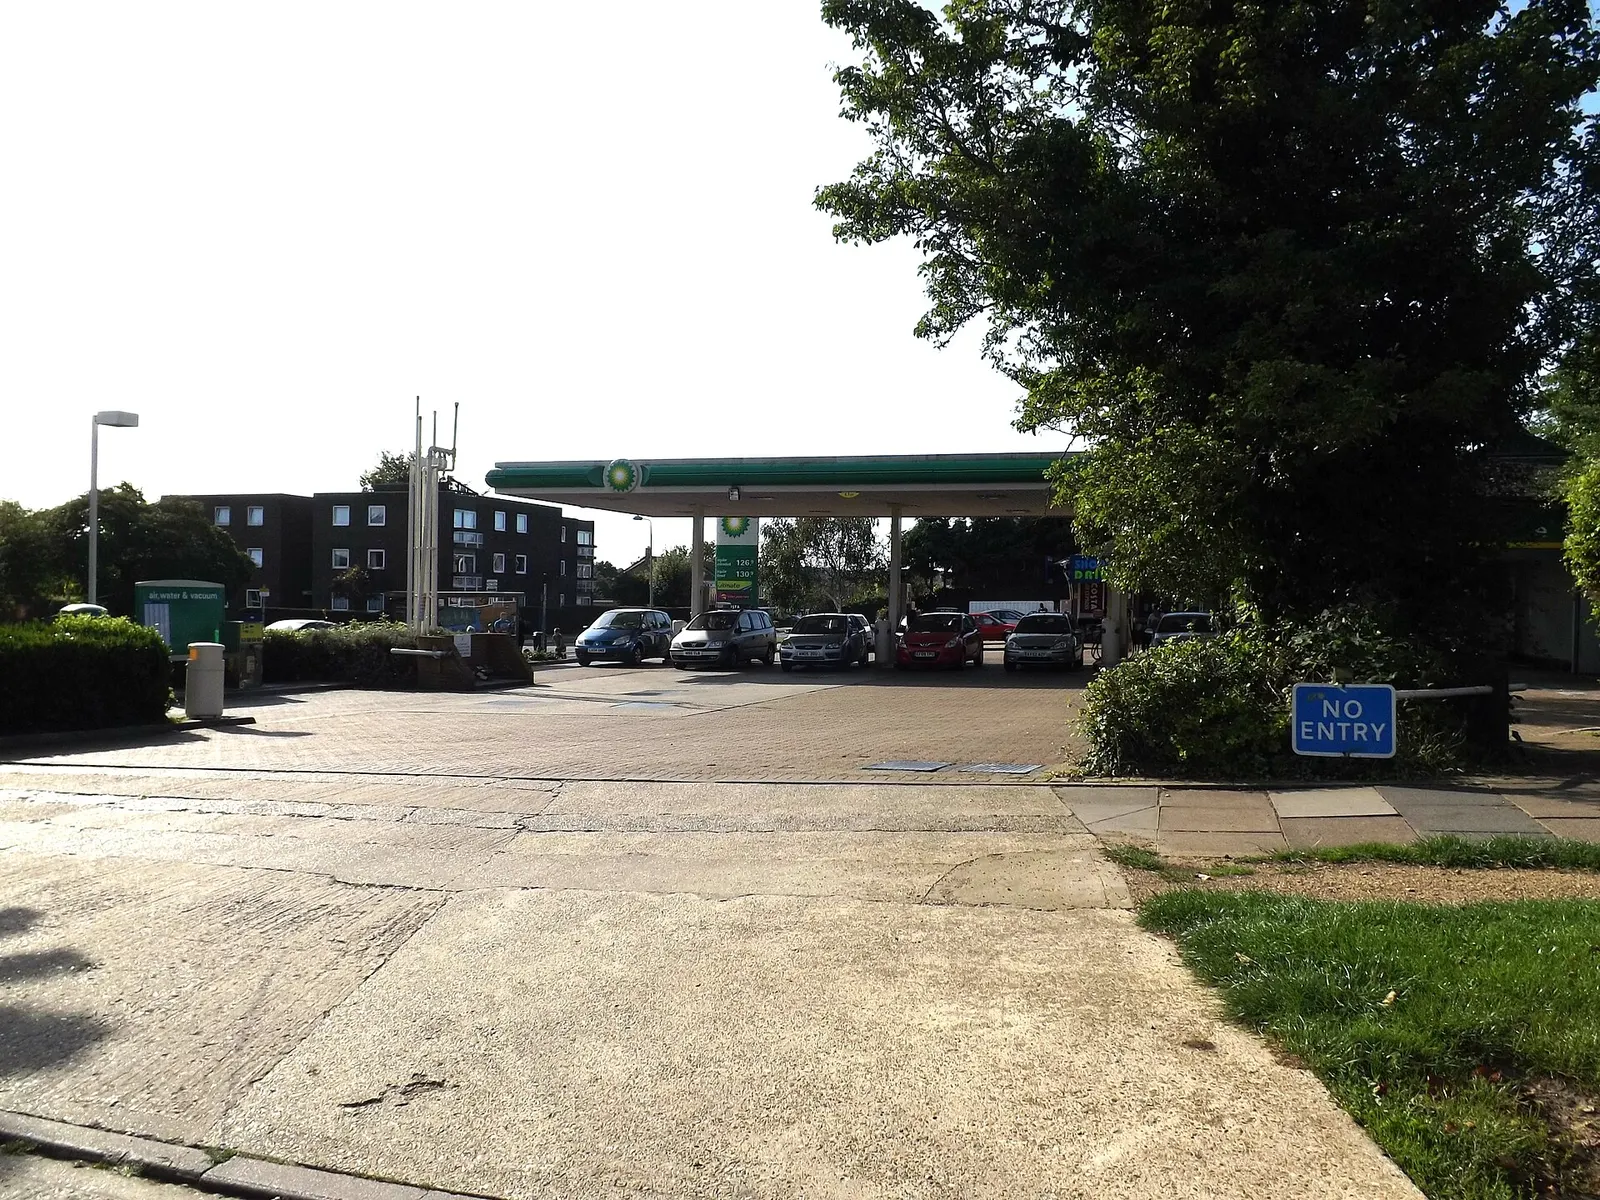
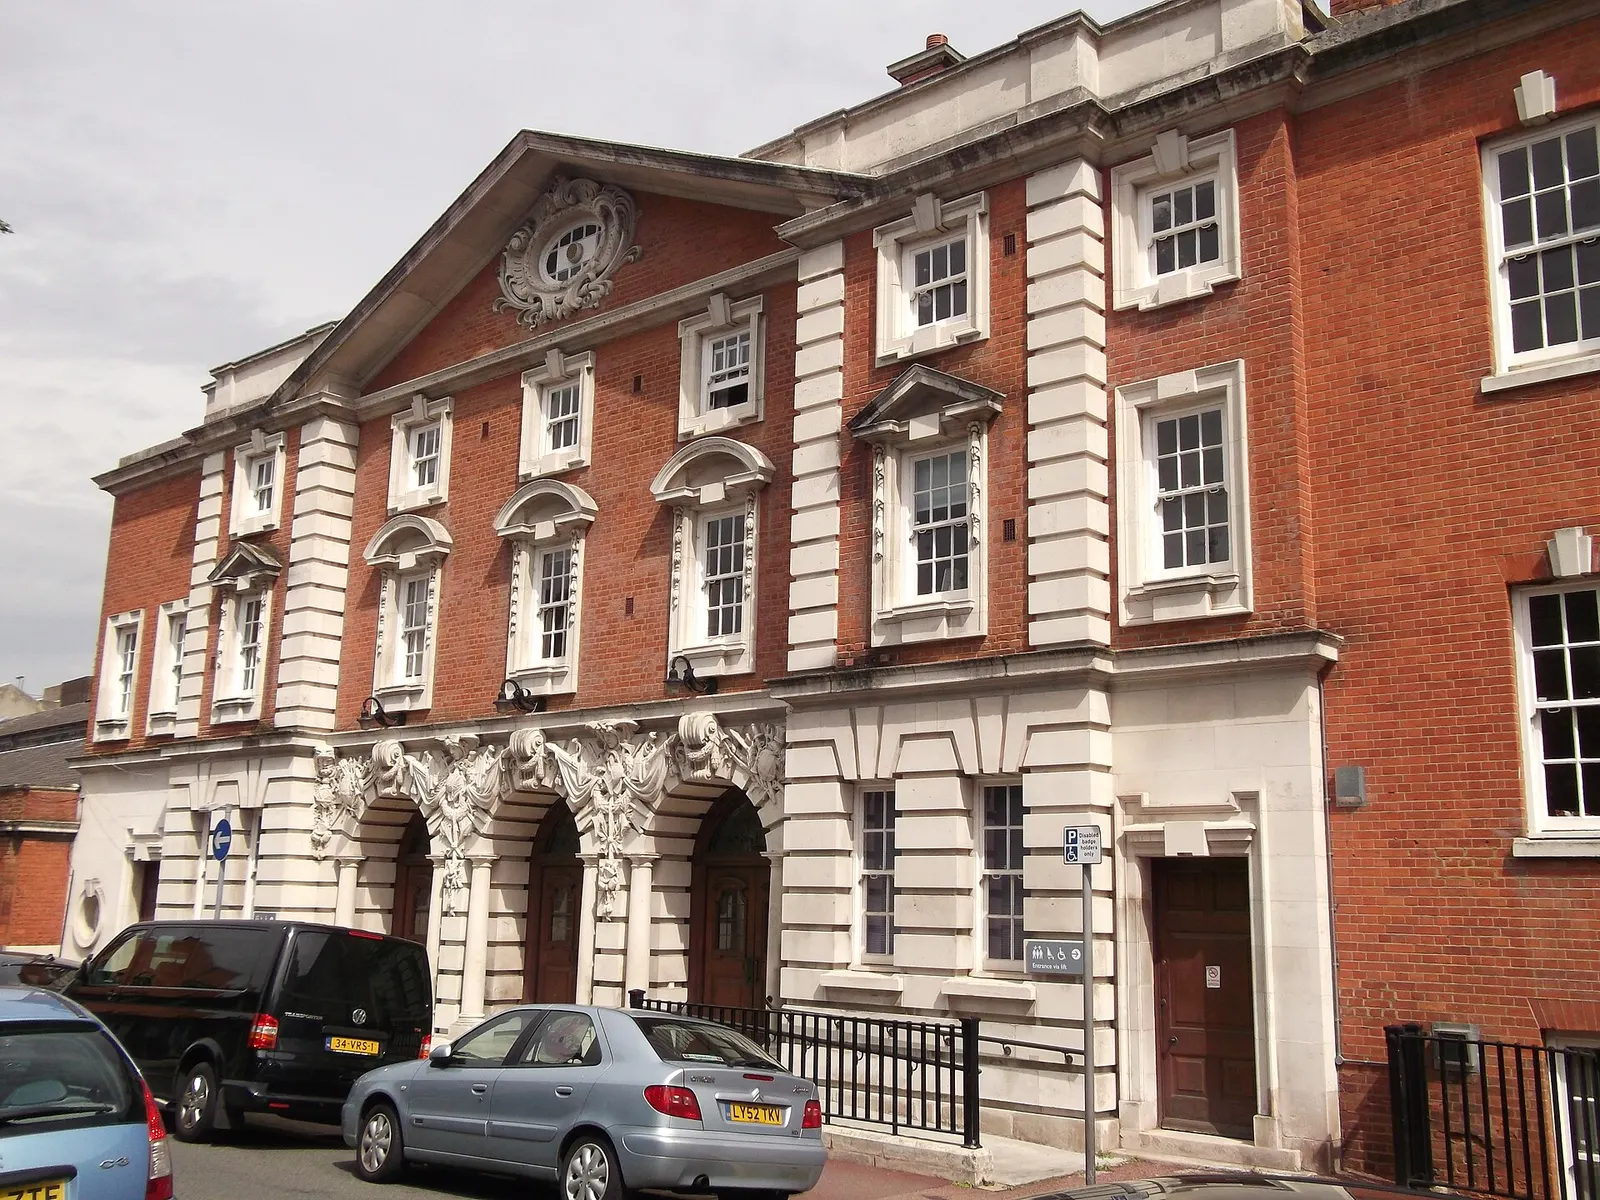
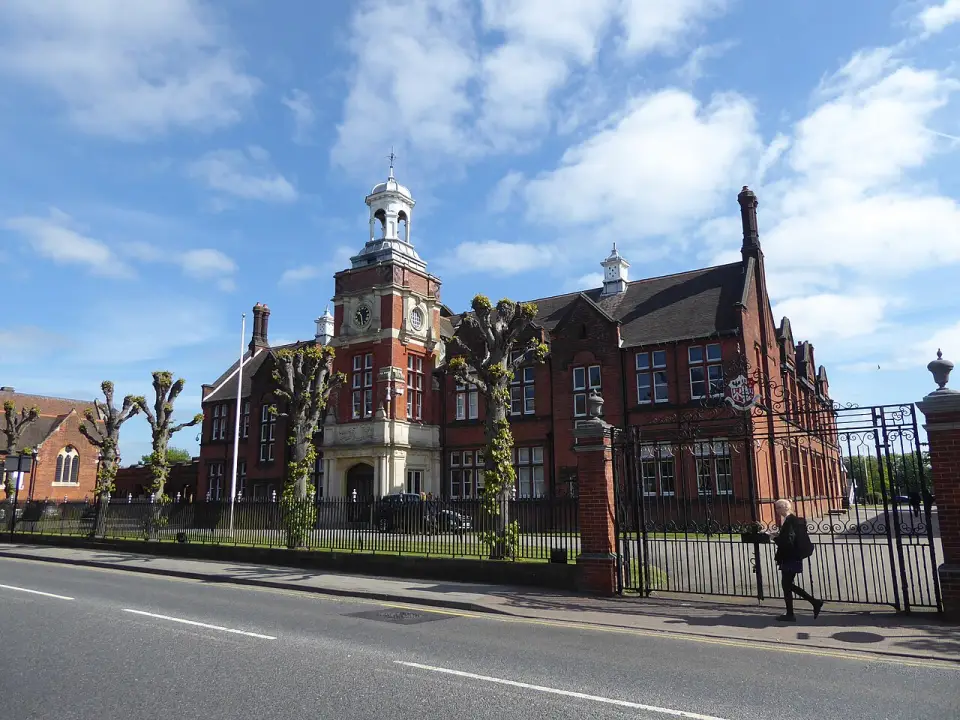
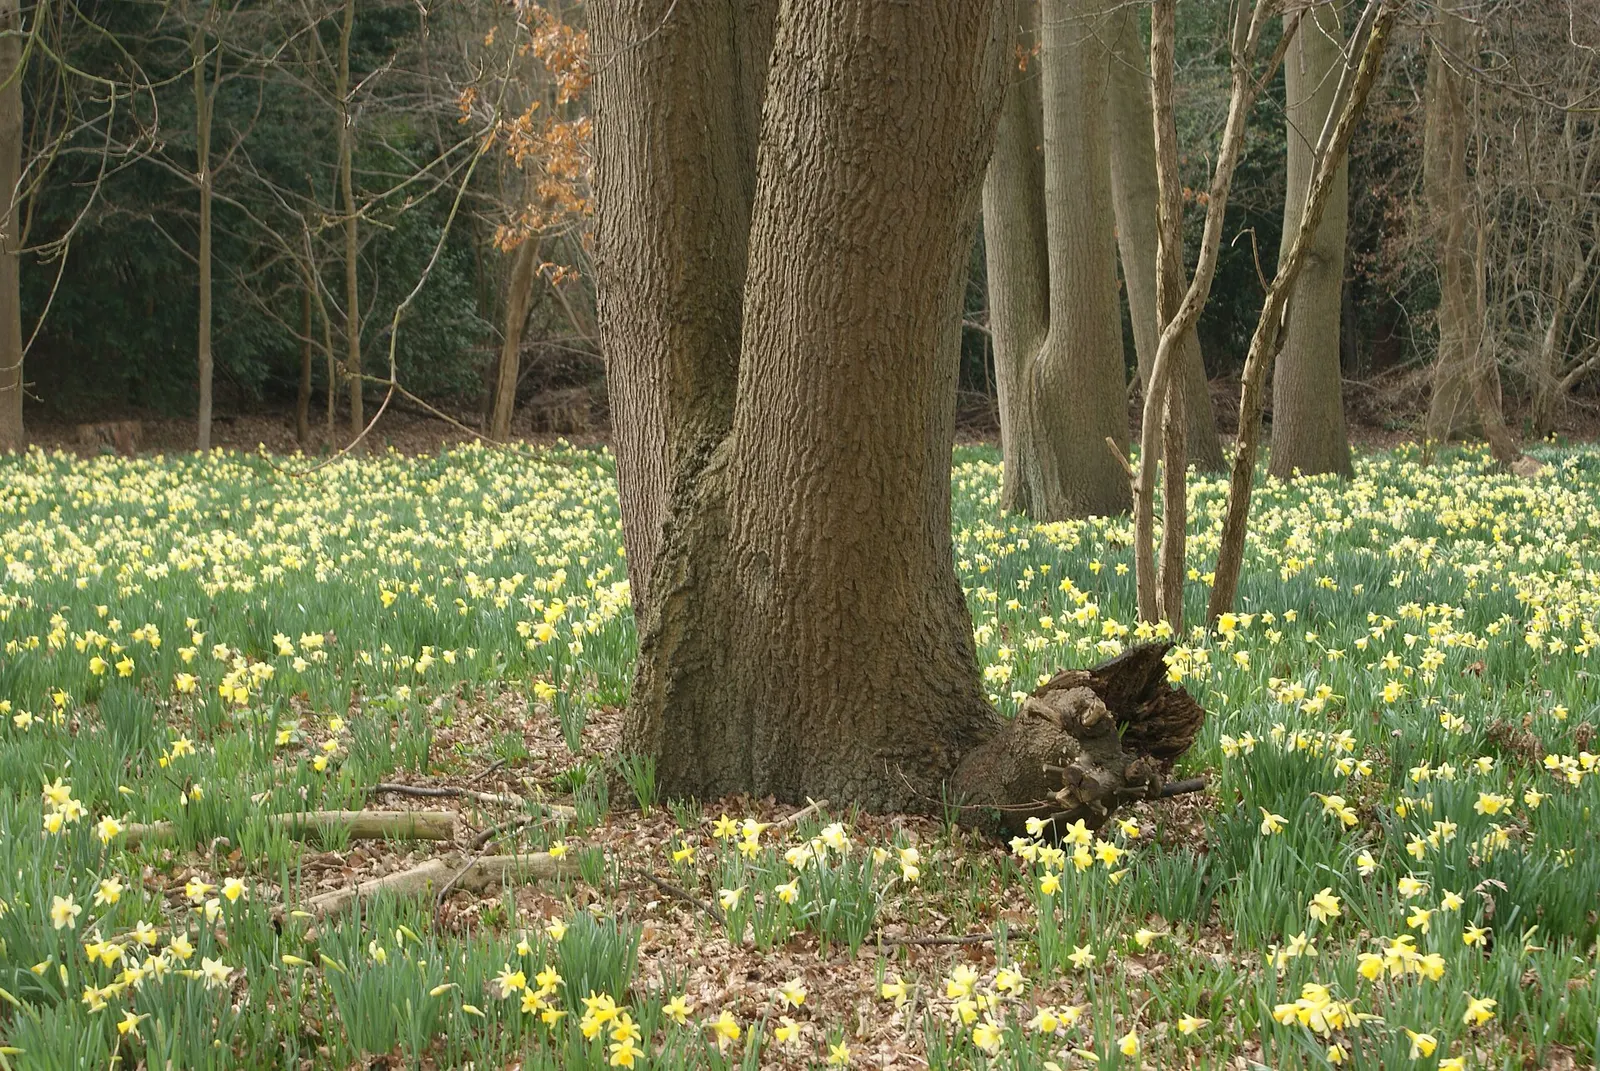
Burnham-on-Crouch in pictures
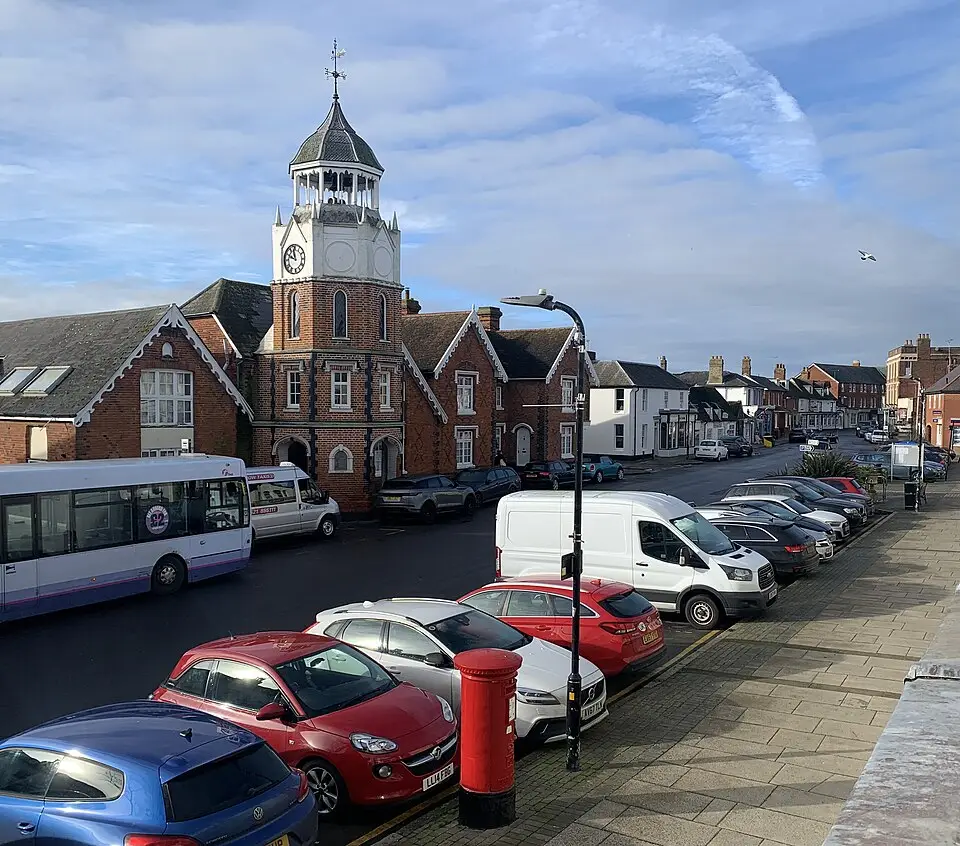
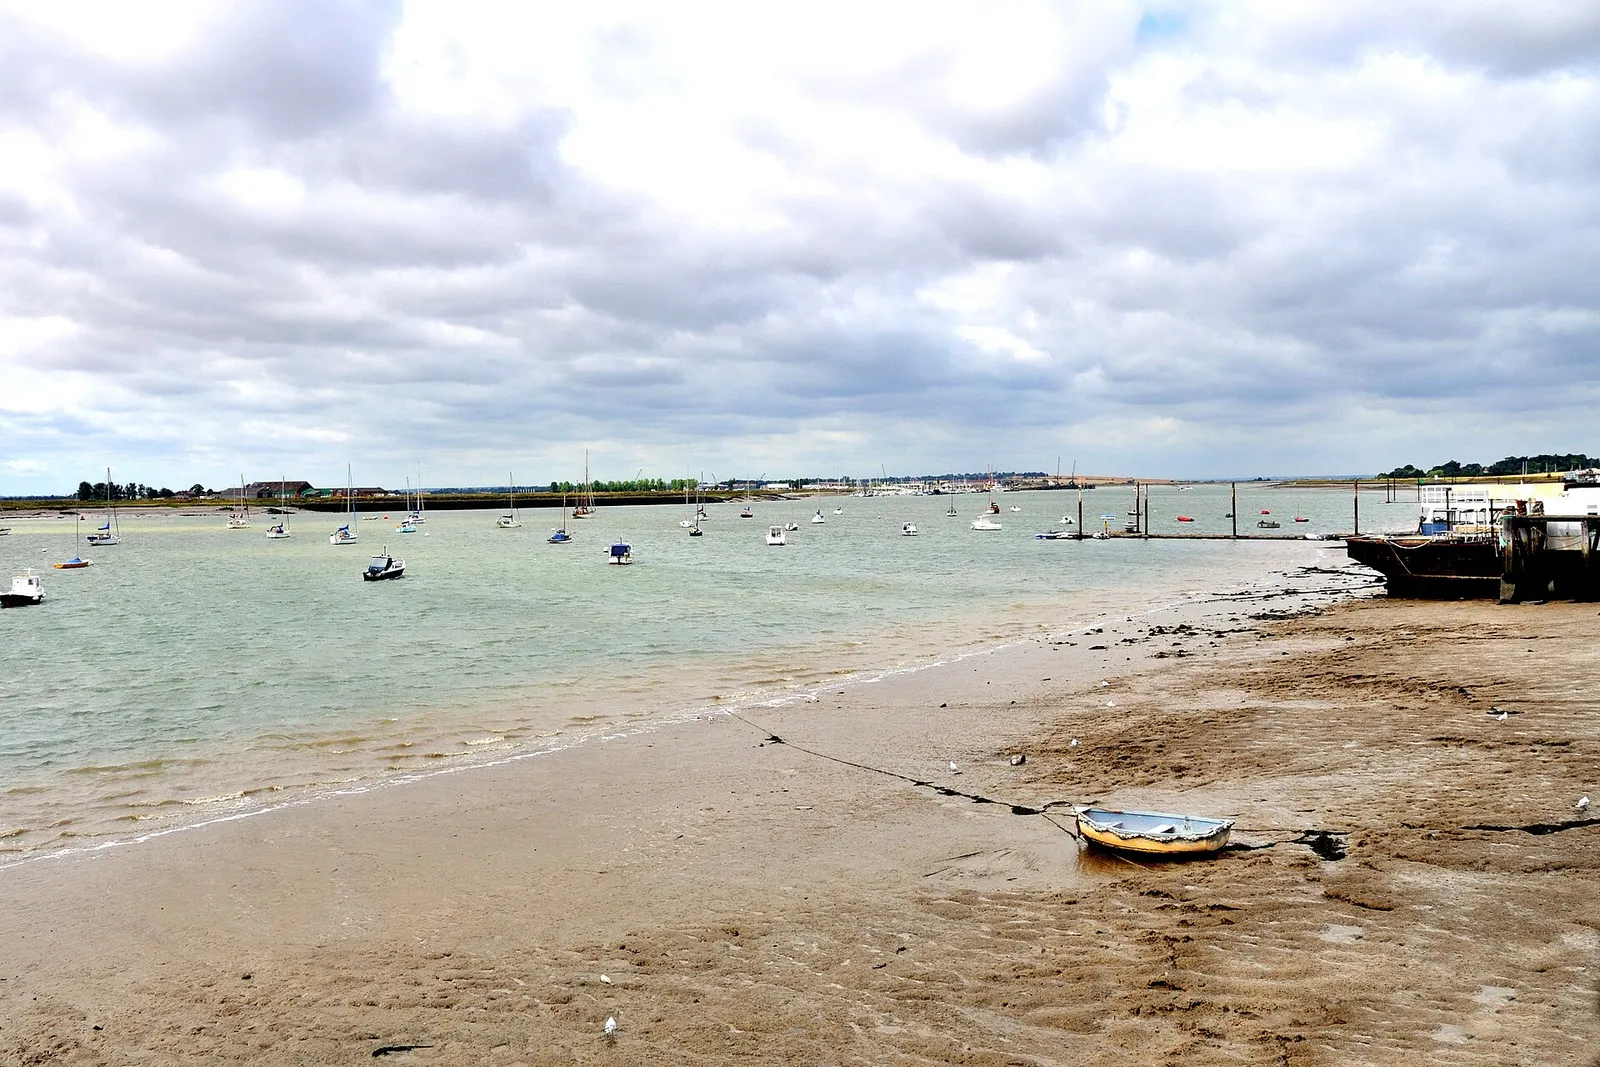
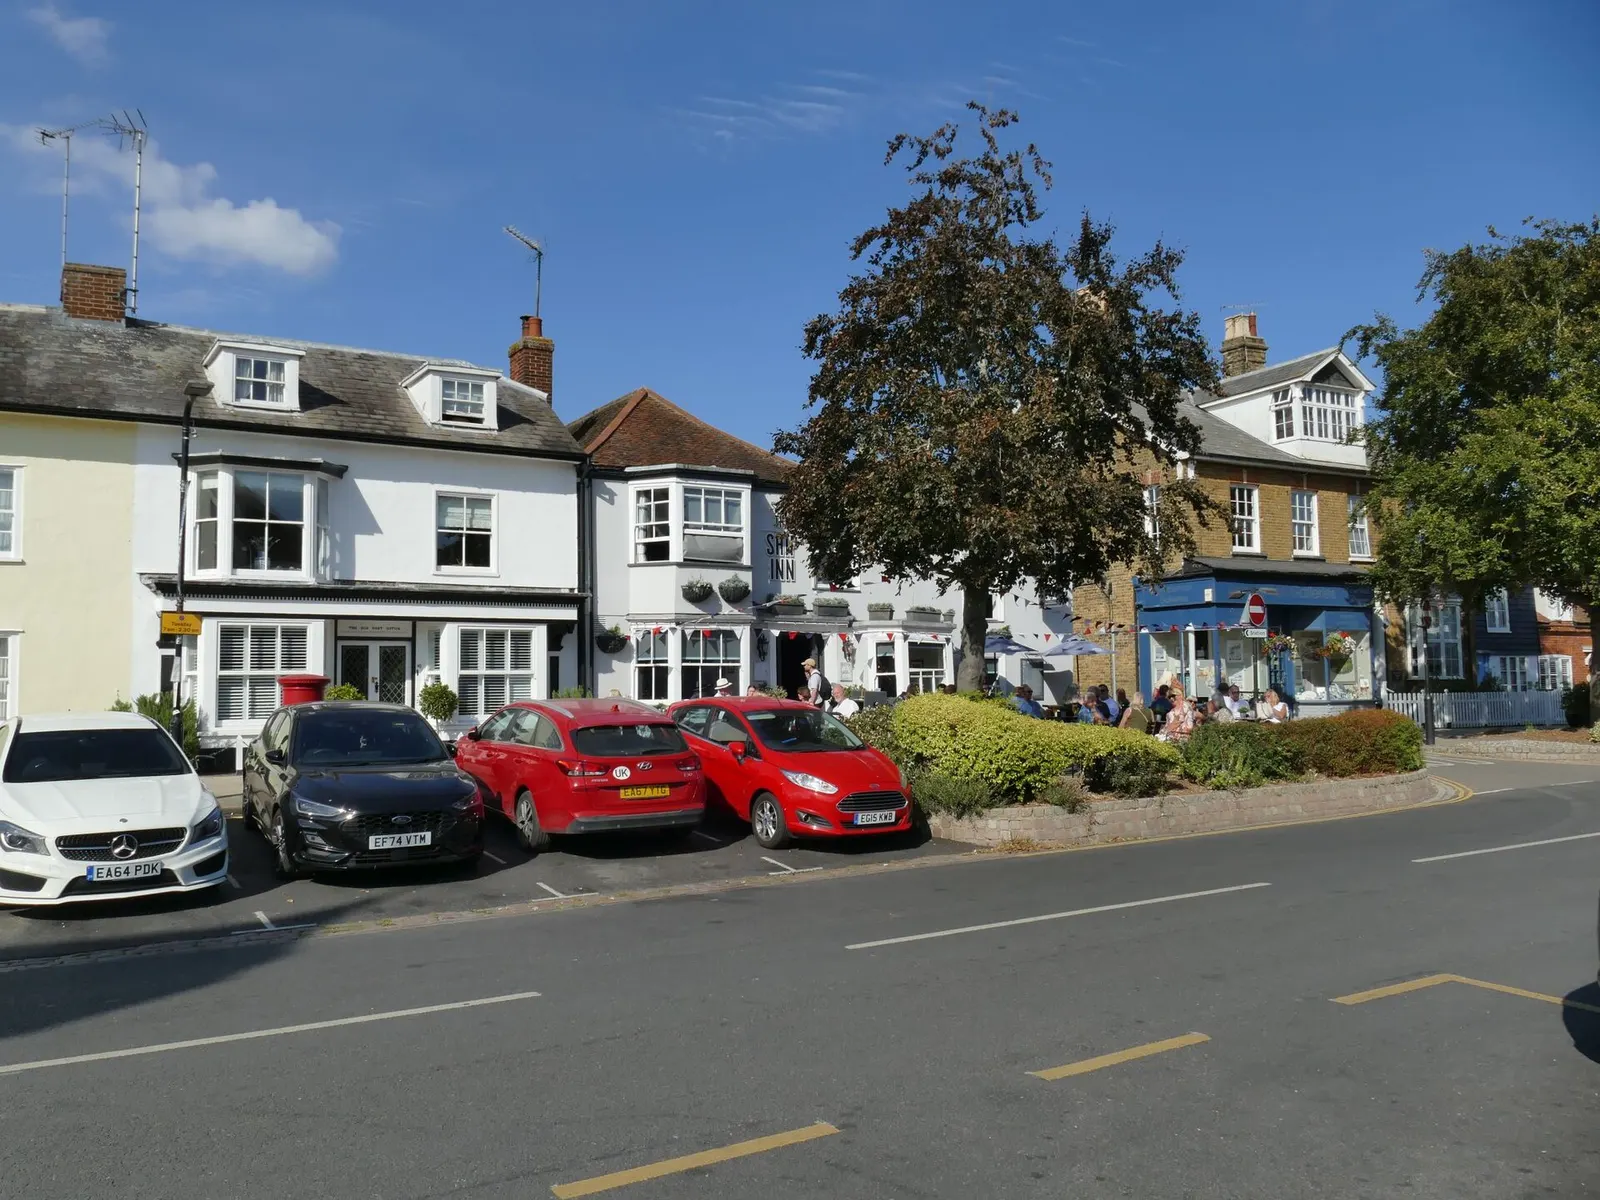
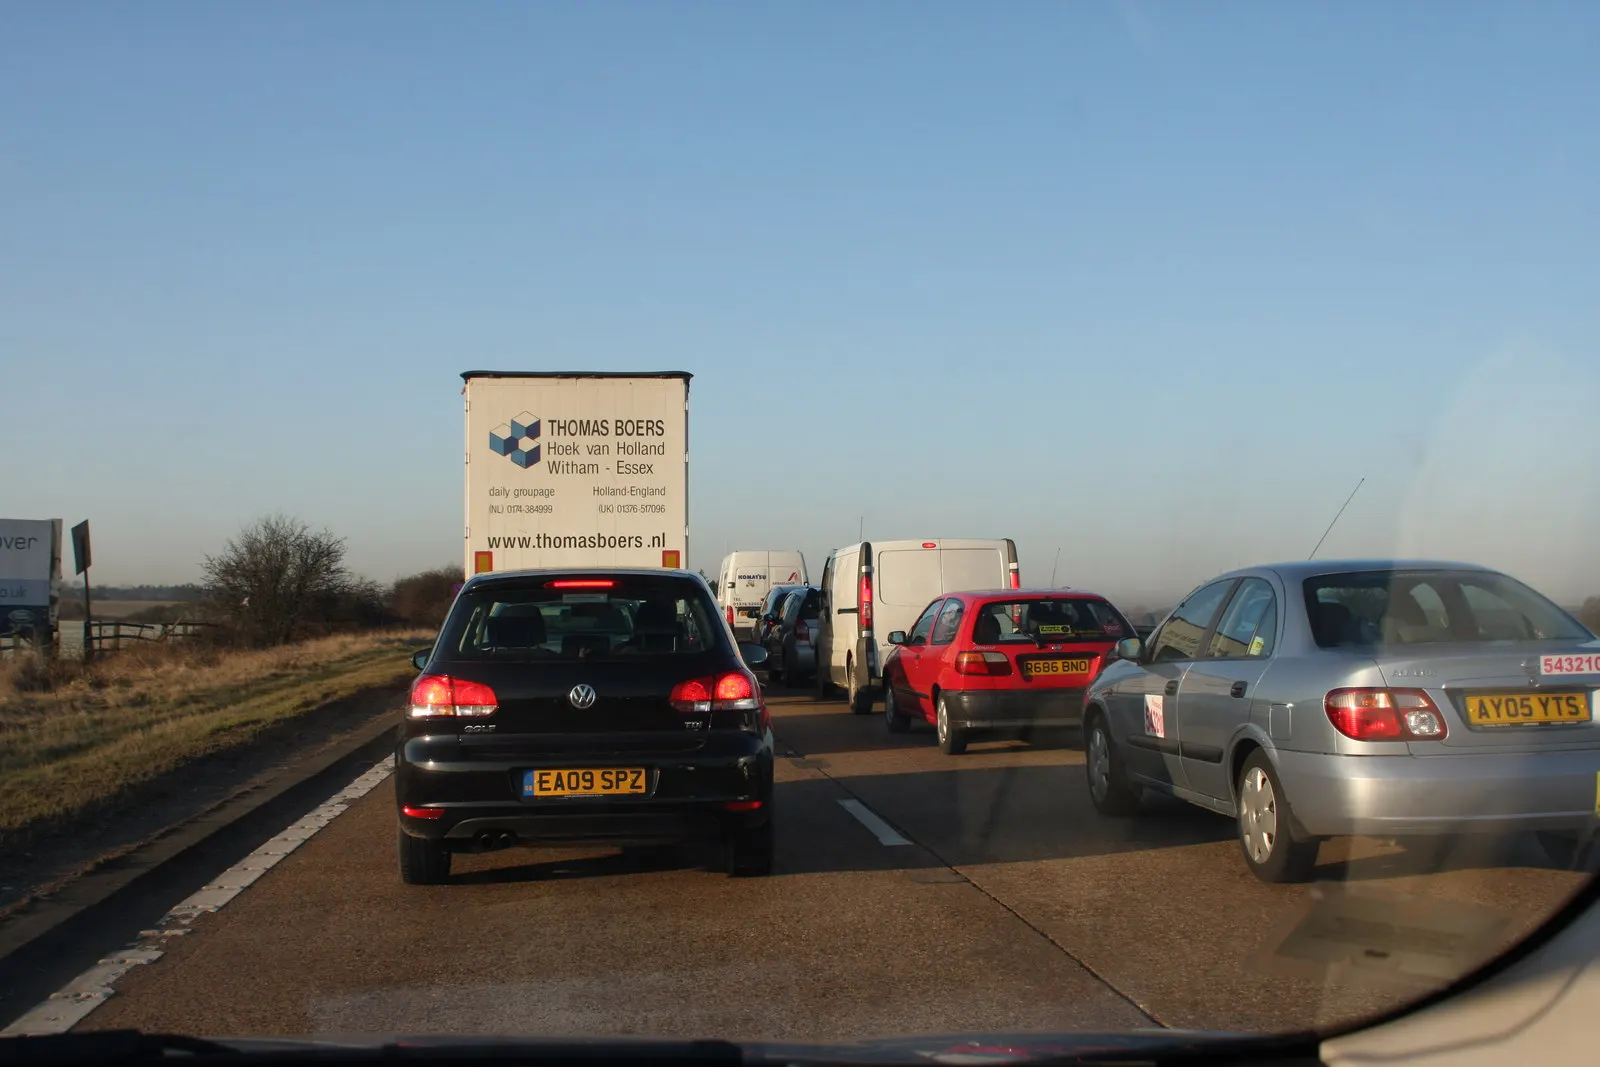
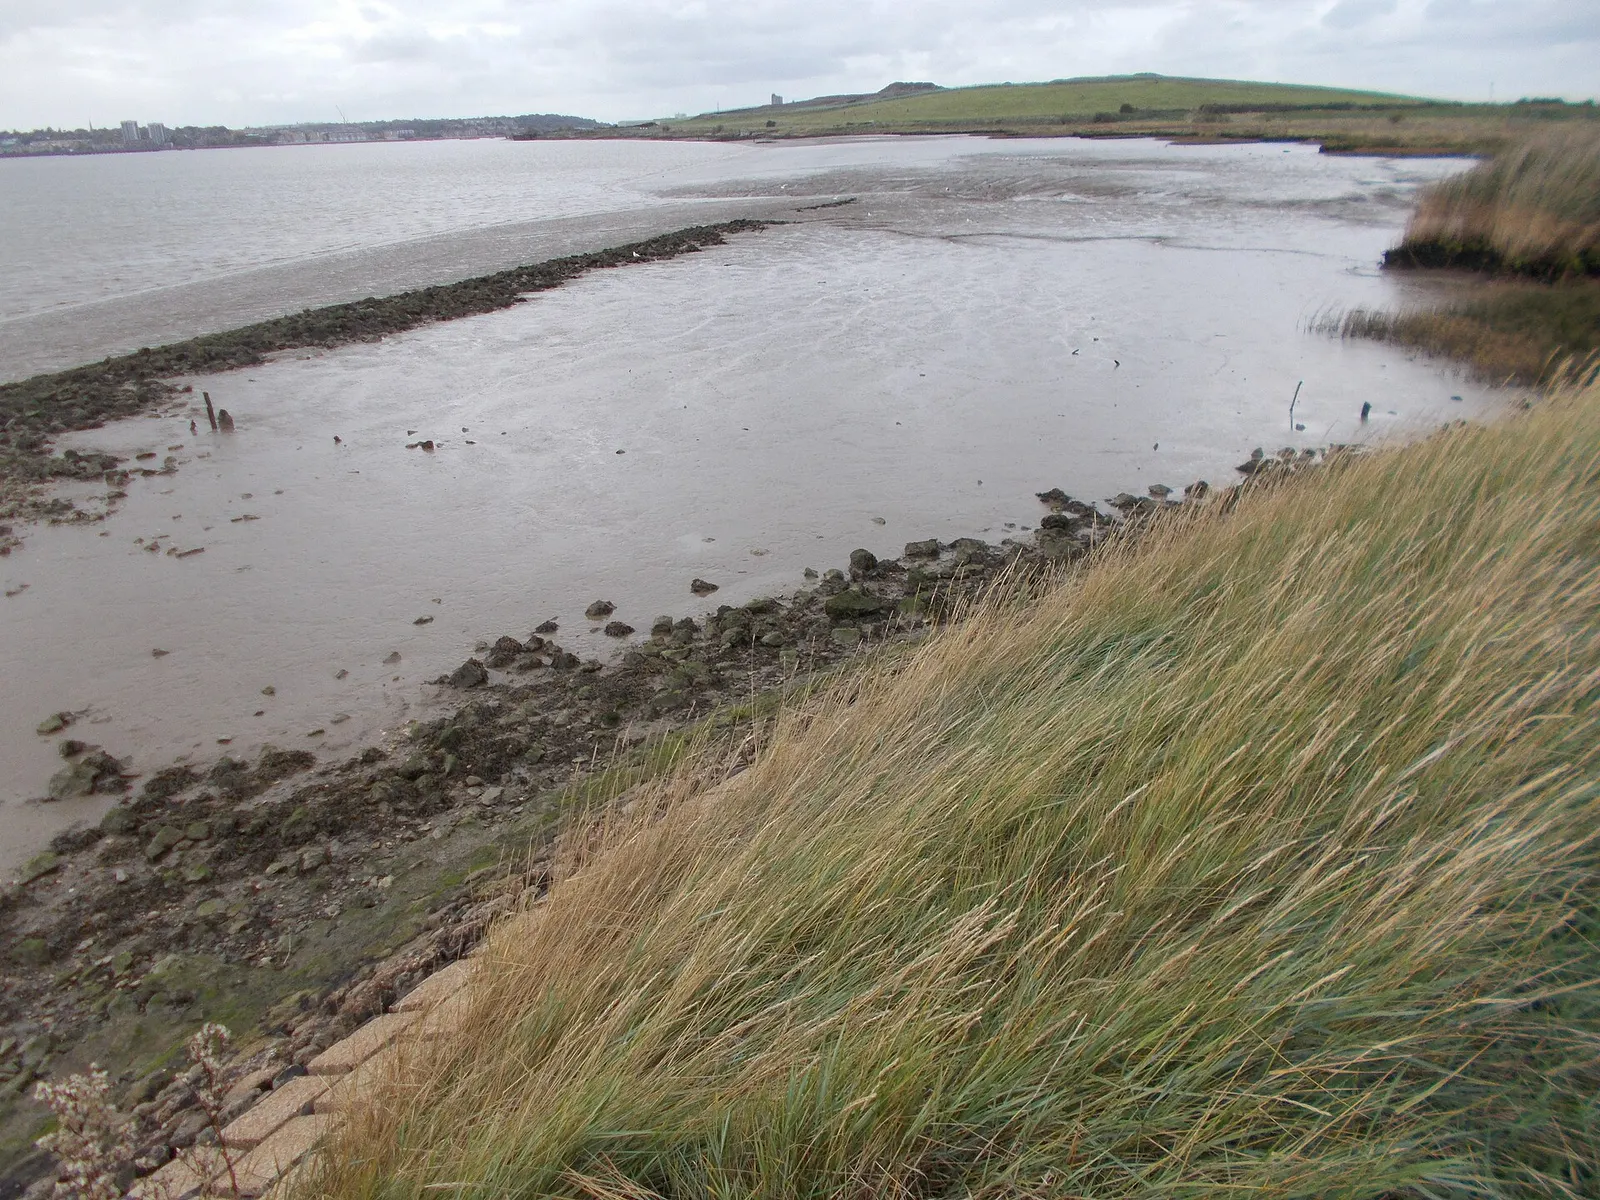
Photographs of the town and the country around it, shared by their photographers under Creative Commons licences. Each is shown whole and resized only.
Burnham on CrouchPhoto: FenchurchAvenue, CC0 (creativecommons.org/publicdomain/zero/1.0/deed.en). commons.wikimedia.org/wiki/File:Burnham_on_Crouch.jpg
In pictures
View across the estuary - Burnham-on-CrouchPhoto: Brian Chadwick, CC BY-SA 2.0 (creativecommons.org/licenses/by-sa/2.0). commons.wikimedia.org/wiki/File:View_across_the_estuary_-_Burnham-on-Crouch_-_geograph.org.uk_-_3971601.jpgThe Ship Inn, Burnham-on-CrouchPhoto: Stephen Craven, CC BY-SA 2.0 (creativecommons.org/licenses/by-sa/2.0). commons.wikimedia.org/wiki/File:The_Ship_Inn,_Burnham-on-Crouch_-_geograph.org.uk_-_8140264.jpg
Crime, September
Recorded crime rose 2%
Police recorded 45 crimes in the Burnham-on-Crouch area in September 2026, up 2% on the 44 recorded in September 2025.
The month before, August, had 63. September is the latest month police.uk has published.
The most common type of crime recorded was violence and sexual offences, at 27 or 60% of the total. Next came anti-social behaviour (5) and drugs (3).
A year earlier
44September 2025
The month before
63August 2026
Most common
Violence and sexual offences60% of the total
Crime, September
45crimes recorded in September 2026
What was recorded
Violence and sexual offences made up 60% of the month's total, with 27 crimes. Anti-social behaviour (5), drugs (3), other crime (2) and other theft (2) followed.
Where it was recorded
police.uk places each crime at a nearby point on the map, not at an address. In September the most were on or near Parking Area (7), Brickwall Close (3) and Church Road (3).
How crimes are counted
Crimes are counted where they were recorded, and police.uk publishes approximate locations, so a busy town centre or main road adds to the total.
Month by month
41Oct
39Nov
31 (lowest)Dec
61Jan
31Feb
33Mar
34Apr
45May
57Jun
58Jul
63 (highest)Aug
45Sep
The busiest month shown was August at 63 crimes and the quietest was December at 31.
Source: police.uk. Crimes and anti-social behaviour reported in the town's mapped area. Locations are approximate and figures can be revised.
House prices, September
House prices rose 5.0%
The average home in the Maldon council area cost £406,165 in September 2026, 5.0% more than a year earlier.
That was 0.6% more than in August. September is the latest month HM Land Registry has published.
Detached houses averaged £596,082 and flats and maisonettes £179,987. First-time buyers paid £317,488 on average.
These figures cover the whole Maldon council area, not the town alone, and the index is revised as more sales are registered.
On the month
Up 0.6%
On the year
Up 5.0%
First-time buyers
£317,488average in September
House prices, September
£406,165average house price in September 2026
By type of home
Detached houses averaged £596,082 in September, semi-detached houses £365,391, terraced houses £290,664 and flats and maisonettes £179,987.
A year on
Compared with a year earlier, detached houses were up 5%, semi-detached houses were up 6%, terraced houses were up 5% and flats and maisonettes were up 2%.
First-time buyers
First-time buyers paid £317,488 on average, up 5% on a year earlier.
Month by month
£380,899£406,165
Oct£389,323
Nov£388,246
Dec£384,937
Jan£380,899
Feb£389,571
Mar£398,592
Apr£404,241
May£395,423
Jun£394,205
Jul£399,342
Aug£403,791
Sep£406,165
Over the months shown the average was highest in September at £406,165 and lowest in January at £380,899.
Source: HM Land Registry, UK House Price Index, for the Maldon council area. Recent months can be revised.
Home sales, August
40 home sales registered so far
HM Land Registry has so far registered 40 home sales in the Maldon council area for August 2026. Sales registered late will add to that.
The most expensive was a detached house in Althorne, sold for £935,000. A sale can take months to reach the register, so this chapter runs two months behind the issue.
Of the sales registered, 0 were new builds and 0 were for £1 million or more.
The figures cover the whole Maldon council area.
Most expensive sale
£935,000a detached house in Althorne
Middle price paid
£381,750half sold for less
New-build sales
0
Home sales, August
40home sales registered for August 2026
What sold
Detached houses were the most common sale, at 19 or 48% of the total, followed by semi-detached houses (11), terraced houses (7) and flats and maisonettes (3).
What they cost
Half of the homes sold for £381,750 or less. 10 were sold for £300,000 or less.
Month by month
88Sep
115 (highest)Oct
109Nov
99Dec
57Jan
50Feb
81Mar
54Apr
57May
46Jun
58Jul
40 (lowest)Aug
Recent months grow as late sales are registered, so they cannot yet be compared with earlier months.
Source: HM Land Registry Price Paid Data, standard sales at full market value in the Maldon council area.
Jobs
The claimant count rose 9%
1,015 people in the Maldon council area were claiming out-of-work benefits in October 2026, up 9% on the 930 claiming in October 2025.
That is 2.5% of residents aged 16 to 64, compared with 4.1% across England.
The figures cover the whole Maldon council area and are published as official statistics in development.
England
4.1%claimant rate
A year earlier
930October 2025
The month before
1,015September 2026
Jobs
2.5%of residents aged 16 to 64 claiming out-of-work benefits in October 2026
Month to month
1,015 people were claiming in October, the same as in September and 85 more than a year earlier.
What the count measures
The claimant count is the number of people claiming benefit mainly because they are out of work, including some Universal Credit claimants who are in work on low pay.
Month by month
9301,045
Nov940
Dec930
Jan965
Feb960
Mar980
Apr990
May980
Jun1,030
Jul1,045
Aug1,005
Sep1,015
Oct1,015
Over the months shown the count was highest in July at 1,045 and lowest in December at 930.
Source: Office for National Statistics claimant count, from Nomis, for the Maldon council area.
New businesses
9 new companies registered
9 companies were registered at addresses in Burnham-on-Crouch in October 2026, according to Companies House.
The most common line of business was freight transport by road, with 2 new companies.
A registered address can be an accountant's or an agent's office, so not every company listed trades from Burnham-on-Crouch.
Companies that have since closed are not counted, so earlier months can be a little higher than shown.
The month before
8September 2026
Limited companies
9100% of the month's companies
Lines of business
8
New businesses
9companies registered in October 2026
What they do
After that came business and domestic software development (1), general cleaning of buildings (1), information technology consultancy activities (1) and joinery installation (1).
How they are set up
Private limited companies account for 9 of the 9 listed, or 100%.
Month by month
6 (lowest)Nov
11Dec
15 (highest)Jan
10Feb
12Mar
6Apr
6May
8Jun
14Jul
8Aug
8Sep
9Oct
Companies that have since closed are not counted, so earlier months can be a little higher than shown.
Source: Companies House. Companies by the month they were incorporated and the town of their registered office.
The past 12 months
Burnham-on-Crouch, the past 12 months
The 12 months to October 2026 side by side: crimes recorded, average house price and homes sold. A dash means there is no figure for that month yet.
November
Crimes recorded
39
Average house price
£388,246
Homes sold
109
December
Crimes recorded
31
Average house price
£384,937
Homes sold
99
January
Crimes recorded
61
Average house price
£380,899
Homes sold
57
February
Crimes recorded
31
Average house price
£389,571
Homes sold
50
March
Crimes recorded
33
Average house price
£398,592
Homes sold
81
April
Crimes recorded
34
Average house price
£404,241
Homes sold
54
The past 12 months
May
Crimes recorded
45
Average house price
£395,423
Homes sold
57
June
Crimes recorded
57
Average house price
£394,205
Homes sold
46
July
Crimes recorded
58
Average house price
£399,342
Homes sold
58
August
Crimes recorded
63
Average house price
£403,791
Homes sold
40
September
Crimes recorded
45
Average house price
£406,165
Homes sold
–
October
Crimes recorded
–
Average house price
–
Homes sold
–
Sources
About the figures
Crime
Crimes and anti-social behaviour reported to police within the town's mapped area, as published on police.uk. Locations are approximate and figures can be revised.
House prices
The UK House Price Index from HM Land Registry, for the whole Maldon council area rather than the town alone. The index is revised as more sales are registered.
Home sales
Standard sales at full market value registered with HM Land Registry, for the whole Maldon council area. Sales registered late can add to these totals.
Jobs
The Office for National Statistics claimant count for the whole Maldon council area: people claiming benefit mainly because they are out of work. It is published as official statistics in development.
New businesses
Companies House registrations, counted in the month of incorporation and placed by registered office, which can be an agent's address. Companies since closed are not counted.
Essex Briefing
Burnham-on-Crouch, every month
Essex Briefing follows these figures all year: crime, house prices, planning, food hygiene, schools and more, for Burnham-on-Crouch and every town in Essex.
This issue was made from official public records. Each chapter names its source, and the notes opposite explain what the figures cover.
Published by Essex BriefingMade from official public records
Essex BriefingThe month in reviewOctober 2026Burnham-on-CrouchPublished by Essex BriefingMade from official public records
Front cover
Drag or swipe a page to turn it, or use the arrow keys.